
Baymard’s UX Research Methodology
This page describe the methodologies used for Baymard Institute’s 200,000+ hours of large scale ecommerce UX research. More specifically, Baymard’s research is based on:
- Usability Testing: 25 rounds of qualitative usability testing with 4,400+ test participant/site sessions following the “Think Aloud” protocol (1:1 moderated lab usability testing in US, UK, Germany, Ireland, and the Nordics). (read more)
- 54 rounds of manual benchmarking of 326 top-grossing ecommerce sites in US and Europe across 790 UX guidelines (175,000+ implementation examples and 275,000+ UX performance scores). (read more)
- In-lab eye-tracking testing. (read more)
- Quantitative studies. (read more)
In the following sections the methodology for each of the four research methodologies is described in detail.
To purchase access to all of the research findings and Baymard Premium go to baymard.com/research. See the Roadmap & Changelog page for what new research Baymard has just published along with the roadmap for what’s coming.
Baymard’s Methodology (video walkthrough)
The below video provides an overview of Baymard’s research methodology and cover how you can utilize the test data in your work:
1) 1:1 Moderated Qualitative ‘Think Aloud’ Testing
A large part of the guideline research content comes from large-scale qualitative usability testing. Specifically it’s based on 25 rounds qualitative usability testing with a total of 4,400+ test participant/site sessions following the “Think Aloud” protocol, 1:1 moderated lab usability testing.
The usability test sessions occured both in in US, UK, Ireland, Germany, and the Nordics (see list of websites further down).
For a study following the think aloud protocol, a binomial probability calculation shows that 95% of all usability problems with an occurrence rate of 14% or higher will be discovered on average, when just 20 test participants were used. Since there will always be contextual site differences, the aim of this research body is not to arrive at final statistical conclusions of whether 61.4% or 62.3% of your users will encounter a specific interface issue. The aim is rather to examine the full breadth of the user’s online shopping behavior, and present the issues which are most likely to cause interface, experience and usability issues for just a reasonable sub-group of your users will face. And as importantly, to present the solutions and design patterns that during testing were verified to consistently constitute a high performing ecommerce user experience.
In total the test participants encountered 34,000+ usability issues in the process of finding, exploring, evaluating, and purchasing products at the tested ecommerce sites – all of which have been distilled into 790 usability guidelines on what consistently constitute a good ecommerce user experience.
The 1:1 usability testing was conducted following the qualitative “Think Aloud” protocol. Each test participant was given 2–4 tasks, depending on the type of task and how fast the participant was. The duration of each participant’s test session was ~ 1 hour long, and the participants were allowed breaks between each site tested. The usability studies tasked real users with finding, evaluating, selecting and purchasing products matching everyday purchasing preferences such as “find a case for your current camera”, “an outfit for a party”, “a jacket you’d like for the upcoming spring”, try to change your account password, etc.
The participants were told to behave as they would on their own, including abandoning a site for a competitor and going off-site to search for information. When experiencing problems, the test participants were asked open-ended questions such as What are you thinking right now?, Why did you click there?, What did you expect would happen?, etc.
If the test participants got completely stuck, they were not helped at first. If they were still unable to proceed, they were given help to get past a specific problem, were given another task, or were directed to another test site for the same task. On such occasions, it was noted in the research log and counted as a “failed task.” A task was also recorded as failed if test participants completely misinterpreted a product due to the product page layout or features; for example, if a participant ended up concluding they wanted product A because it was smaller than product B, when in fact the opposite was the case.
Any personal information submitted by accident has been edited out of the screenshots used in this report or replaced with dummy data. The compensation given was up to $100 in cash (except ‘B2B’ and ‘hard to recruit’ participants who were given up to $300).
The test sites were rotated between the test participants to distribute participants evenly on the tested sites.
The 240+ test sites across our 25 rounds of testing are:
- Food/grocery/food delivery/meal kit sites tested: Aldi, Amazon Whole Foods, Blue Apron, ButcherBox, Chipotle, Crowd Cow, Dinnerly, Domino’s, Doordash, Gobble, HelloFresh, Home Chef, Hungryroot, Imperfect Foods, Instacart, Oceanbox, Panera Bread, Sea to Table, Shipt, Starbucks, Sunbasket, Target, Theo Chocolates, Walmart, and Uber Eats.
- Travel & Accomodation sites tested: OTAs: Booking.com and Expedia. Large-brand hotel chains: IHG, Hilton, and Marriott. Small boutique hotel sites: The Artezen Hotel, NobleDEN Hotel, The Nolitan Hotel, Sixty LES Hotel, and The Sohotel. Whole property rental sites: Airbnb, Plum Guide, Sonder, TurnKey, and Vrbo. Car rental: Enterprise.com, Avis. Airlines: Southwest Airlines, United Airlines.
- Travel Tour & Event Booking sites tested: Arctic Adventures, Blue Hawaiian Activities, Fun London Tours, Golden Tours, Gray Line Iceland, HeliNY Sightseeing, London Top Sights, New York Helicopter Tours, Reykjavik Excursions, Roberts Hawaii, Shoreline Sightseeing, Tall Ship Windy, Volcano Tours, Wendella, Zip Aviation
- Apparel & Accessories sites tested: Adidas, Allbirds, American Apparel, ASOS, Appalachian Mountain Company, All About Dance, American Eagle Outfitters, Banana Republic, Boozt, Bonprix, Boohoo, Blue Nile, Catbird, Cole Haan, Columbia Sportswear, Coastal.com, Daniel Wellington, Designer Shoe Warehouse, eBags, Esprit, Everlane, Express, Farer, Francesca’s, Foot Locker, GAP, Gerry Weber, Gilt, Go Outdoors, Greats, Herschel, Hush Puppies, H&M, Levi’s, L.L. Bean, Madewell, Milo, Miinto, mvmt, Neiman Marcus, Next, Nicce, Nordstrom, Old Navy, Oakley, Patagonia, Pandora, Puma, REI, Sahalie, ShopBop, Stance, Ted Baker, Thousand Fell, Under Armour, Urban Outfitters, Zalando, and Zappos.
- Electronics & Office sites tested: Apple, Argos.co.uk, AppliancesOnline.co.uk, Best Buy, B&H Photo, Bose, Currys.co.uk, Cyberport.de, Crutchfield, Elgiganten.dk, HiFiKlubben.dk, HP, JBL, Mirror, Notebooksbilliger.de, Newegg, Office Depot, Otto.de, Pixmania, Power.dk, Samsung, and Staples.
- Mass Merchant sites tested: Amazon, Best Buy, Etsy, Kohl’s, Macy’s, Marks & Spencer, Overstock, Sears, Target, Tesco, and Walmart.
- Health, Beauty sites tested: Chemist Direct, CVS, Drugstore.com, L’Occitane, Maya Chia, MAHALO Care, Monastery Made, Sephora, Tempo, Tonal, Thomann, Ulta, Perfume.com, and Walgreen’s.
- Vitamins & Supplements sites tested: eVitamins, GNC, iHerb, Lucky Vitamin, Nature Made, Nature’s Sunshine, PipingRock, Pure Formulas, Puritan’s Pride, Swanson Vitamins, Vitacost, Vitamin Shoppe, and Vitamin World.
- Home Improvement & Hardware sites tested: Build.com, Home Depot, Lowe’s, and Staples.
- SaaS, Digital, & Software sites tested: BitDefender, Box.com, Chanty, Cisco Webex, Egnyte, Flock.com, GoToMeeting, Kaspersky, McAfee, Microsoft, Norton, Slack, Sync.com, and Zoom.us.
- Houseware & Furniture sites tested: Ashley, AllPosters, Bed Bath & Beyond, Bob’s Discount Furniture, Burke Decor, Caraway, Crate&Barrel, CB2, Container Store, The Company Store, Equal Parts, Great Jones, Hayneedle, IKEA, JoyBird, KitchenAid, Lamps Plus, Nordstrom, Parachute, Pottery Barn, Raymour & Flanigan, Room & Board, Serena & Lily, Snowe Home, Williams Sonoma, and Wayfair.
- B2B Electronic Components and Machinery sites tested: Analog Devices, Arrow, Corestaff, Digi-Key, Farnell / Newark, Future Electronics, Microchip, Mouser, RS Components, STMicroelectronics, TDK Corporation, TE Connectivity, and TTI.
- Other sites tested: Amnesty Shop. FTD, 1-800-Flowers, Fandango, HobbyTron, PetSmart, Toys R Us, and The Entertainer/TheToyShop.com.
Additional test methodology notes specific for the 25 rounds of testing:
-
Notes specific for the Homepage & Category Navigation testing
For the Homepage & Category Navigation testing: in order to avoid artificially forcing the participants to use category navigation on the tested sites, this study was conducted as a combined ecommerce category navigation and search study. This way it was up to the test participants themselves to decide if they preferred to search or navigate via the categories to find what they were looking for (i.e., they were never asked to use one approach over the other). Furthermore, it allowed the participants to mix category navigation and search.
During the test sessions the participants experienced 900+ usability issues specifically related to the homepage, category and main navigation, site taxonomy, category pages, and similar. The issues ranged from minor interruptions to severe misconceptions about the basic premises of how to find products at an ecommerce site, with task completion rates going as low 10-30% when asked to find fairly common products, e.g. a sleeping bag for cold weather, a spring jacket, or a camera with a case.
The 19 tested sites were: Amazon, Best Buy, Blue Nile, Chemist Direct, Drugstore.com, eBags, Gilt, Go Outdoors, H&M, IKEA, Macy’s, Newegg, Pixmania, Pottery Barn, REI, Tesco, Toys’R’Us, The Entertainer/TheToyShop.com, and Zappos.
-
Notes specific for the On-Site Search testing
For the On-Site Search testing: in order to avoid artificially forcing the participants to use search on the tested sites, this study was conducted as a combined ecommerce category navigation and search study. This way it was up to the test participants themselves to decide if they preferred to search or navigate via the categories to find what they were looking for (i.e., they were never asked to use one approach over the other). Furthermore, it allowed the participants to mix category navigation and search.
During the test sessions, more than 750 usability issues arose specific to ecommerce search. All of these issues have been analyzed and distilled into 49 guidelines on search usability, specifically for an ecommerce context.
The observed search issues often proved so severe that 31% of the time the participants were either unable to find the items they were looking for or became so frustrated that they decided to abandon. And 65% of the time, the participants needed more than one search attempt, with three to four query iterations not being uncommon. This is despite testing major ecommerce sites and the tasks being fairly basic, such as “find a case for your laptop,” “find a sofa set you like,” etc.
The 1:1 “think aloud” test protocol was used to test the 19 sites: Amazon, Best Buy, Blue Nile, Chemist Direct, Drugstore.com, eBags, Gilt, Go Outdoors, H&M, IKEA, Macy’s, Newegg, Pixmania, Pottery Barn, REI, Tesco, Toys’R’Us, The Entertainer/TheToyShop.com, and Zappos.
-
Notes specific for the Product Lists & Filtering testing
For the Product Lists & Filtering testing: in order to avoid artificially forcing the participants to use search on the tested sites, this study was conducted as a combined ecommerce category navigation and search study. This way it was up to the test participants themselves to decide if they preferred to search or navigate via the categories to find what they were looking for (i.e., they were never asked to use one approach over the other). Furthermore, it allowed the participants to mix category navigation and search.
During the test sessions the participants experienced 580+ usability issues specifically related to the product list design and tools. Crucially, significant performance gaps were identified between the tested sites’ product list implementations. Sites with just mediocre product list implementations saw massive abandonments rates of 67-90% whereas other sites with better implementations saw only 17-33% abandonments, despite the test participants trying to find the exact same products. These sites all had equally relevant products to what the test participants were looking for, the difference stemmed solely from the design and features of each site’s product list.
The 19 test sites were: Amazon, Best Buy, Blue Nile, Chemist Direct, Drugstore.com, eBags, Gilt, Go Outdoors, H&M, IKEA, Macy’s, Newegg, Pixmania, Pottery Barn, REI, Tesco, Toys’R’Us, The Entertainer/TheToyShop.com, and Zappos.
-
Notes specific for the Product Details Page testing
For the Product Details Page testing: the participants mainly tested the product details page, and the 1:1 qualitative test sessions used a task design that facilitated comparison shopping across sites.
Each task started by asking the participants to choose between two product types, and pick the one they could relate to best. For example, asking participants to choose between shopping for a grill or a fridge, or choosing between shopping for a backpack or a baby gift. After selecting a product type, they were sent to two different product pages, each from a different site (e.g., a gas grill at Lowe’s and another at Home Depot). The two products at each site weren’t identical, but very closely related substitutes, so participants had to perform an actual comparison to determine which suited their needs the best.
The 12 sites tested were: Lowe’s, Sears, Home Depot, Sephora, L’Occitane, Nordstrom, Patagonia, Crutchfield, Bose, KitchenAid, Cole Haan, and eBags.
-
Notes specific for the Cart & Checkout testing
For the Cart & Checkout testing: the usability studies tasked real users completing the purchase for multiple different types of products – all the way from “shopping cart” to “completed sale”.
Each test participant tested 5 - 8 checkouts, depending on the type of task and how fast they were. The duration of each participant’s test session was ~ 1 hour long, and the participant were allowed breaks between each site tested. The participants were on some sites allowed to perform a guest checkout, whereas on other sites they were asked to sign into their existing account (some tasks personal account, other tasks a synthetic account) to complete an account-based checkout flow.
During the test sessions the participants experienced 2,700+ usability issues specifically related to the checkout flow and design. All of these findings have been analyzed and distilled into 134 specific usability guidelines on how to design and structure the best possible performing checkout flow.
The sites tested in the two rounds of 1:1 qualitative think aloud test sessions were:
- Round 1: Wayfair, ASOS, Walmart, Amazon, American Eagle Outfitters, Crate&Barrel, Overstock, and Home Depot.
- Round 2: 1-800-Flowers, AllPosters, American Apparel, Amnesty Shop, Apple, HobbyTron, Levi’s, NewEgg, Nordstrom, Oakley, Perfume.com, PetSmart, Thomann, and Zappos.
-
Notes specific for the Self-Service testing
For the Account & Self-Service testing: For the self-service and account study the testing was done both as in-lab moderated usability testing and as remote moderated usability testing.
The in-lab usability testing gave users a series of account related tasks (using a synthetic account) such as “can you try to update your password/shipping address/newsletter subscriptions”, “you just placed this order, how would you track it” “can you cancel it”, etc.
For the remote moderated usability testing participants were required that were about to purchase items on any given ecommerce site. Using remote testing a series of smaller test sessions were initiated each time they made any order interaction; from ordering, receiving order confirmation emails, tracking order online, receiving the order, initiating order return, return tracking, return confirmation, etc.
In total the participants encountered 1,400 usability issues which have been distilled into the Account & Self-Service guidelines.
The issues were found when testing the follwoing 17 websites: Home Depot, Amazon, Best Buy, Nordstrom, Build, REI, Walmart, B&H Photo, Apple, Appalachian Mountain Company, GAP, All About Dance, Bed Bath & Beyond, Shop Bop, Old Navy, and Sahalie.
-
Notes specific for the Mobile testing
For the Mobile Ecommerce testing: The Mobile ecommerce research is based on two different round of large scale mobile ecommerce testing, of a total of 29 major ecommerce sites. The usability study tasked real users with finding, evaluating, selecting and purchasing everyday products at mobile ecommerce sites.
The 1:1 “think aloud” test protocol was used to test the 29 mobile sites: 1-800-Flowers, Amazon, Avis, Best Buy, Buy.com, Coastal.com, Enterprise.com, Fandango, Foot Locker, FTD, GAP, H&M, Macy’s, REI, Southwest Airlines, Toy’R’Us, United Airlines, Walmart, Target, Overstock, Herschel, Under Armour, JBL, Adidas, Kohl’s, B&H Photo, Newegg, Walgreen’s, and Staples. Each test participant tested 3 - 6 mobile sites, depending on how fast they were. The duration of each participant’s test session varied between 1 and 1.5 hours, and the they were allowed breaks between each site tested.
While these sites are by no means small, the test participants encountered 3,700+ usability-related issues during the test sessions. Ranging from small interruptions with an interface to severe misconceptions about the basic premises of the m-commerce site, resulting in abandonments.
Our studies show that 43.2% of all smartphone or tablet users have abandoned an online order during the checkout flow in the past 2 months. And 61% sometimes or always switch to their desktop devices when having to complete the mobile checkout process. Also, despite testing the mobile ecommerce sites of major ecommerce businesses such as Walmart, Amazon, Avis, United, BestBuy, FTD, Fandango, etc. numerous test participants were unable to complete a purchase at multiple of these sites. Note that the word is unable, not unwilling. The usability issues were that severe.
‘Importance’, ‘Frequency’, and ‘Severity’ Ratings
Each of the 790 guidelines of course aren’t equally important and impactful on the user’s experience. Some issues will be the direct cause for site abandonments, while others will only amount to friction in the form of users stopping, doubting, getting anxious, getting frustrated, or performing futile actions.
Therefore, each of the 790 guidelines have two ratings assigned, a severity rating and a frequency rating:
- Severity: How damaging is it to violate this guideline? There are three degrees. 1) Interruption: the test participants were only interrupted briefly. 2) Disruptive: the test participants came to a full stop in what they were doing and had to actively resolve the issue. 3) Harmful: the test participants were unable to complete their task at hand, often having to abandon the site as a direct consequence.
- Frequency: How many of your users are likely to experience this issue if you don’t adhere to the guideline. This is generally based on how many test participants ran into the issue during testing (adjusted based on test constraints and specific site contexts). There are five degrees: A Few, Several, Most (+50%), Nearly All, and All.

The guideline’s ‘Severity’ and ‘Frequency’ rating is combined into an overall ‘Importance’ rating, that describes the overall importance of reading a guideline in three levels; “Detail”, “Impactful” and “Essential”. This importance level is stated at the top of every guideline page.
Within each topic in Baymard Premium the guidelines are generally listed based on their importance (based on their combined frequency and severity). Hence, the first guidelines in each topic tend to be those with the largest impact on UX, and are often direct roadblocks. That’s not to say the guidelines presented later don’t matter – they are numerous and even if they are unlikely to cause abandonments individually, they can collectively add up and result in a high-friction experience.
While we generally advise to focus on the most severe issues first, the combined impact of a guideline should be judged against the specific cost for making the improvement. In our experience, teams that prioritize this way tend to see the best return on investment.
‘Missed Opportunity’, ‘Web Convention’, and ‘Low Cost’ Guidelines
In addition to the severity and frequency ratings, select guidelines also have one or more special characteristics, that also boost the importance of reading the guideline (the ‘Importance’ rating):
- ‘Missed Opportunity’: If our large-scale usability testing revealed that a guideline has a relative high UX impact (the combined ‘Severity’ and ‘Frequency’), but our benchmarking at the same time reveals that most sites get this part of their design or implementation wrong, then the guideline is defined as a ‘Missed Opportunity’. We strongly recommend that you pay close attention to these guidelines. (The logic is weighted, so medium-impact guidelines need more violations among the benchmarked sites to become a ‘Missed Opportunity’ than a high-impact guideline does).
- ‘Web Convention’: If our benchmarking reveals that 80% or more of the largest ecommerce sites implement a specific guideline correctly then it’s defined as a ‘Web Convention’. While the average ecommerce site will adhere to these guidelines (and most can, therefore, ignore reading them at first), be careful. Because the design pattern and implementation are so common that it’s an experience users are highly accustomed to, be careful about deviating or even breaking this user expectation. Even if your alternative design pattern is good in itself, it’s not what users are used to seeing.
- ‘Low Cost’: If our research team assesses that a specific guideline will be relatively cheap to implement for almost all types of ecommerce sites (both in terms of development resources and content resources), it will be classified as ‘Low Cost’.
2) Benchmarking Methodology
Another major part of the research methodology and dataset is a comprehensive UX benchmark. Specifically, Baymard has conducted 54 rounds of manual benchmarking of 326 top-grossing US and European ecommerce sites across 790 UX guidelines .
The benchmarking specifically consists of “heuristic evaluations” of the 326 ecommerce sites using Baymard’s usability guidelines (derived from the large-scale qualitative usability testing) as the 790 review heuristics and weighted UX scoring parameters.
The UX performance score for each of the 790 guidelines is weighted based on its Frequency and Severity rating, and each site was graded on a 7 point scale, across all 790 guidelines. This has led to a comprehensive benchmark database with 275,000+ manually assigned and weighted UX performance scores, and 175,000+ additional implementation examples for the guidelines from top retailers (organized and performance-verified), each annotated with review notes.
The total UX performance score assigned to each benchmarked site is essentially an expression of how good (or bad) an ecommerce user experience a first-time user will have at the site based on the 790 guidelines.
The specific theme score is calculated using a weighted multi-parameter algorithm with self-healing normalization:
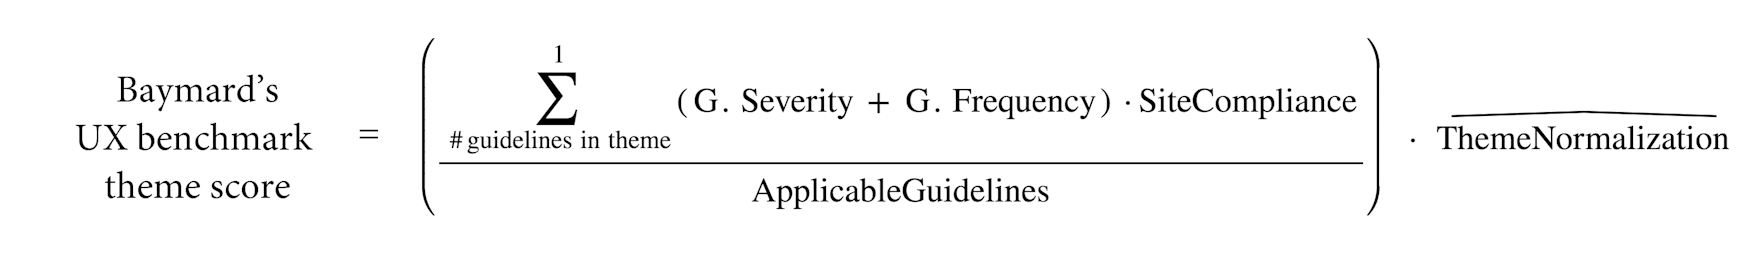
Below is a brief description of the main elements in the algorithm:
- An individual Guideline weighting (“G. Severity + G. Frequency”): A combination of the Severity of violating a specific guideline (either Harmful, which is the worst, Disruptive, or Interruption, as defined in each of the 790 usability guidelines), and the Frequency of occurrence of the specific guideline (i.e., how often the test participants experienced it during the usability study).
- A Site Compliance rating, that describe the degree of which a specific site adheres to each of the 790 guidelines; Adhered High, Adhered Low, Neutral, Issue resolved, Violated Low, Violated High, N/A. This is what the Baymard benchmarker set for the individual site according to Baymard’s ‘How to Review’ protocol, and after accounting for the individual site’s context and target audience.
- The scores are summarized for all guidelines within the theme (typically 50-130 guidelines per theme, 790 in total), and then divided by the total number of applicable guidelines (to ensure “N/A” does not influence the score).
- Lastly, the score is normalized using a self-healing normalization factor for each of the 7 overarching research and benchmark themes. 50% of the normalization is based on a “State of the Art” implementation definition by Baymard senior staff (based on the the underlying usability test data of the 50-130 guidelines within the theme). The other 50% of the definition is based on the UX performance score distribution of the 326 benchmarked sites. The latter component of “326 site’s UX performance” makes the normalization self-healing as the requirements for a “poor”, “mediocre”, “decent”, “good”, and “perfect” UX performance will increase over time, as sites improve year over year. This normalization also enables UX performance comparisons across the themes and across multiple benchmark years.
The 175,000+ annotated highlights/pins found in the benchmark are examples that the reviewer judged to be of interest to the reader. It’s the site’s overall adherence or violation of a guideline that is used to calculate the site’s UX performance score. Thus, you may find a specific Highlight that shows an example of how a site adheres to a guideline, even though that same site is scored to violate the guideline (typically because the site violates the guideline at another page), and vice versa.
All site reviews were conducted by Baymard employees. All reviews were conducted as a new customer would experience them — hence no existing accounts or browsing history were used (except for Accounts & Self-Service benchmarking). For the US-based and UK based sites an IP address from that country was used. In the case multiple local or language versions of a site existed, the US/UK site version was used for the benchmark.
In the benchmark screenshots only 1-2 versions of each page is depicted, but the reviewer investigated 15-30 other pages which were used for the benchmark scoring and detailed highlight screenshots as well.
Notes specific for:
- The Mobile Web and the Mobile App benchmarks were conducted on the latest version of iOS at the time of benchmarking.
- The Product Page benchmark: for each of the 90+ PDP UX assement parameters 4-9 product pages were chosen for each website review to act as the screenshot and UX-scoring foundation. The 4-9 products chosen were among the most featured and popular products on the website.
- The Checkout benchmark: The shortest path, for a new customer, through the checkout was always the checkout flow benchmarked (e.g. the “guest checkout” option).
3) Eye-Tracking Testing
In addition to the qualitative usability testing following the “think aloud” protocol, eye-tracking was also used for select testing. The eye-tracking test study included 32 participants using a Tobii eye-tracker, with a moderator present in the lab during the test sessions (for task and technical questions only), which took approx. 20–30 minutes. All eye-tracking test participants tested 4 sites: Cabelas, REI, L.L.Bean, and AllPosters. The eye-tracking test sessions began by starting the test participants at a product listing page and asking them to, for example, “find a pair of shoes you like in this list and buy it.”
The eye-tracking participants were given the option to use either their personal information or a made-up ID handed on a slip of paper. Most opted for the made-up ID. Any personal information has been edited out of the screenshots used in this report or replaced with dummy data. The compensation given was up to $50 in cash.
4) Quantitative Studies
The fourth research methodology in the Baymard dataset is quantitative studies. These large-scale studies include adults 18 and older who have purchased a product online in relevant verticals within the 3 to 6 months prior to the survey. Audiences are census-balanced across age, gender, income, and region. The sample size for these surveys is at least 1,000 adult participants, with larger samples used for studies that segment results more finely.
How to Read and Use the UX Performance Graphs
The UX benchmark graph contains the summarized results of the 54 rounds of manual UX performance benchmarking Baymard Institute’s research staff have conducted of 326 top-grossing US and European ecommerce sites.
This UX performance benchmark database contains a total of 275,000+ manually assigned and weighted UX performance scores, along with 175,000+ “best practice” implementation examples from 326 top retailers. The graph summarizes the 50,000+ most recent UX performance ratings.
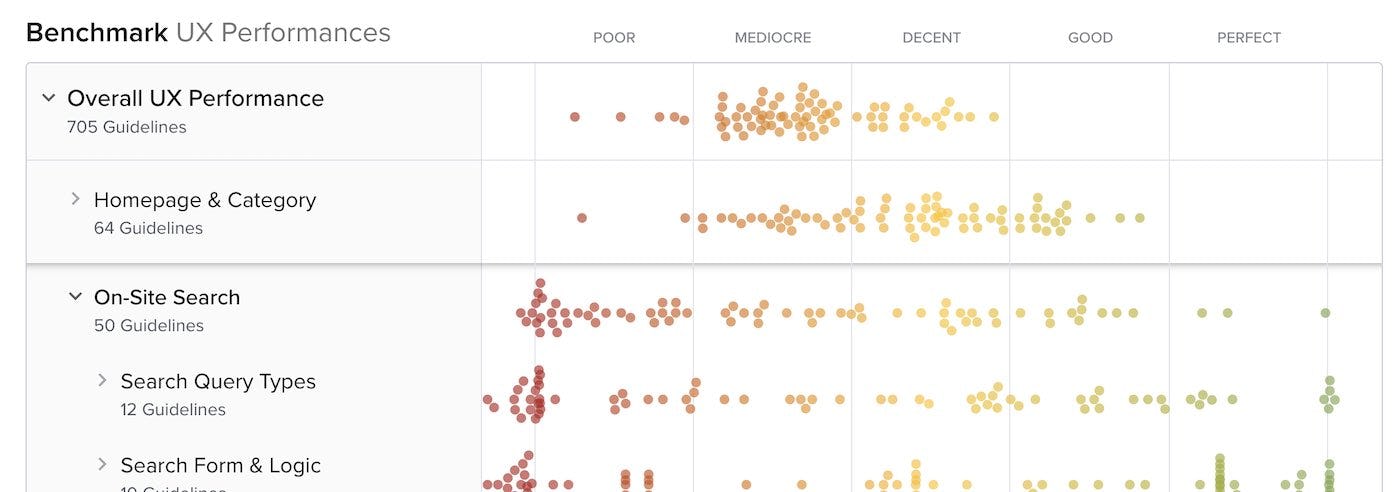
The total UX performance score assigned to each of the 326 benchmarked ecommerce sites is an expression of how good or bad a user experience that a first-time user will have at the site, based on 790 weighted ecommerce UX guidelines.
The graph itself has multiple nested layers, where you can drill down into the more granular sub-performances. To reveal the deepest layers and the 790 guidelines, you will need Baymard Premium research access. Full access also provides you a tool to self-assess your own websites and prototypes, to get a fully comparable scorecard with direct performance comparison to the public benchmark database.
Graph Benchmarking & Scoring Methodology
The UX performance benchmarking is conducted as a “heuristic evaluations” of the 326 ecommerce sites. But instead of using 10-20 broad and generic usability heuristics, Baymard’s usability guidelines are used as 790 highly detailed and weighted review heuristics. These 790 guidelines come directly from Baymard’s 200,000+ hours of large-scale qualitative usability testing.
The UX performance score for each of the 790 guidelines is weighted based on its observed impact during usability testing, and each of the 326 sites is graded on a 7 point scale, across all 790 guidelines.
The specific theme and topic performances are calculated using a weighted multi-parameter algorithm with self-healing normalization. This ensures that the general progress of the ecommerce industry and users’ ever-increasing expectations are factored into the performance scoring (updated multiple times each year):
For full testing details, see our research methodology description.
Legal
Baymard Institute can’t be held responsible for any kind of usage or correctness of the provided information.
The screenshots used may contain images and artwork that can be both copyright and/or trademark protected by their respective owners. Baymard Institute does not claim to have ownership of the artwork that might be featured within these screenshots, and solely captures and stores the website screenshots in order to provide constructive review and feedback within the topic of web design and web usability.
Citations, images, and paraphrasing may not be published anywhere without first having written consent from Baymard (reach out to info@baymard.com).
See the full terms and conditions for Baymard’s public and paid-for services, content, and publications.