49 Cart Abandonment Rate Statistics 2025
70.19% – average documented online shopping cart abandonment rate
Based on the data we collected, we’ve calculated the average cart abandonment rate of 70.19%. This value is an average calculated based on 49 different studies containing statistics on ecommerce shopping cart abandonment.
Abandonment rate statistics:
79.53% SalesCycle 2023 (retrieved July 11, 2023)
68.70% Fresh Relevance 2022 (retrieved August 16, 2022)
79.30% Kibo Commerce 2021 (retrieved August 16, 2022)
59.22% Fresh Relevance 2021 (retrieved November 19, 2021)
81.08% SalesCycle 2021 (retrieved November 19, 2021)
57.60% Freshrelevance 2020 (retrieved December 21, 2020)
84.27% SaleCycle 2020 (retrieved December 21, 2020)
77.13% Barilliance 2019 (retrieved December 21, 2020)
56.82% Fresh Relevance 2018 (retrieved March 28, 2019)
75.60% SaleCycle 2018 (retrieved June 20, 2018)
81.40% AbandonAid 2017 (retrieved June 20, 2018)
76.90% SaleCycle 2017 (retrieved June 20, 2018)
78.00% Listrak 2016 (retrieved January 9, 2017)
75.50% Adobe 2016 (retrieved January 9, 2017)
68.80% Barilliance 2016 (retrieved January 9, 2017)
74.52% SaleCycle 2016 (retrieved September 21, 2016)
71.39% Barilliance 2015 (retrieved January 14, 2016)
68.95% IBM 2015 (retrieved December 7, 2015)
75.00% Listrak 2015 (retrieved May 8, 2015)
75.60% SaleCycle 2015 (retrieved May 8, 2015)
68.38% IBM 2014 (retrieved December 2, 2014)
72.00% Listrak 2014 (retrieved September 26, 2014)
69.20% Vibetrace 2013 (retrieved March 25, 2014)
62.30% Fireclick 2014 (retrieved March 12, 2014)
74.00% Barilliance 2013 (retrieved March 12, 2014)
67.41% IBM / Coremetrics 2013 (retrieved December 6, 2013)
78.00% AbandonAid 2013 (retrieved December 6, 2013)
60.32% Triggered Messaging 2013 (retrieved July 28, 2013)
75.00% Listrak 2013 (retrieved July 3, 2013)
67.00% Comscore 2012 (retrieved July 3, 2013)
74.23% SaleCycle 2013 (retrieved April 26, 2013)
80.30% Rejoiner 2012 (retrieved February 14, 2013)
61.85% IBM / Coremetrics 2012 (retrieved December 20, 2012)
74.76% Fireclick / DigitalRiver 2012 (retrieved November 2, 2012)
76.00% Listrak 2012 (retrieved July 17, 2012)
72.31% Fireclick / DigitalRiver 2011 (retrieved February 25, 2012)
62.31% IBM / Coremetrics 2011 (retrieved February 25, 2012)
72.00% SeeWhy 2011 (retrieved February 25, 2012)
71.00% SeeWhy 2010 (retrieved February 25, 2012)
55.00% Forrester Research 2010 (retrieved February 25, 2012)
63.68% IBM / Coremetrics 2010 (retrieved February 25, 2012)
69.38% Fireclick / DigitalRiver 2010 (retrieved February 25, 2012)
62.14% MarketLive 2009 (retrieved February 25, 2012)
71.00% Forrester Research 2009 (retrieved February 25, 2012)
63.19% IBM / Coremetrics 2009 (retrieved February 25, 2012)
68.00% SeeWhy 2009 (retrieved February 25, 2012)
62.01% IBM / Coremetrics 2008 (retrieved February 25, 2012)
61.36% IBM / Coremetrics 2007 (retrieved February 25, 2012)
59.80% MarketingSherpa 2006 (retrieved February 25, 2012)
Average: 70.19% abandonment rate
Last updated: July 11, 2023
Why this list?
We created this list because we needed some abandonment statistics ourselves for our Ecommerce Checkout Usability study and articles.
When searching for these statistics we found a myriad of articles citing the same sources, as well as large fluctuations in the actual abandonment rates. So to save you and ourselves that hassle we decided to gather all statistics in a single place.
We’ve also calculated an average so it’s easy to cite just one number instead of 49 different ones.
Know of any cart abandonment statistics not on this list? Then send an email to support@baymard.com.
Why Users Abandon Their Cart
Now in all fairness to the ecommerce industry, a large portion of cart abandonments are simply a natural consequence of how users browse ecommerce sites – many users will be doing window shopping, price comparison, saving items for later, exploring gift options, etc. These are largely unavoidable cart and checkout abandonments.
In fact, our latest quantitative study of reasons for abandonment found that 43% of US online shoppers have abandoned a cart within the last 3 months because “I was just browsing / not ready to buy”. Most of these will abandon even before they initiate the checkout flow. However, if we segment out this “just browsing” segment, and instead look at the remaining reasons for abandonments we get the following distribution:

Reasons for Abandonments During Cart & Checkout (2025 data):
- 39% Extra costs too high (shipping, tax, fees)
- 21% Delivery was too slow
- 19% I didn't trust the site with my credit card information
- 19% The site wanted me to create an account
- 18% Too long / complicated checkout process
- 15% Returns policy wasn't satisfactory
- 15% Website had errors / crashed
- 14% I couldn't see / calculate total order cost up-front
- 10% There weren't enough payment methods
- 8% The credit card was declined
Unlike the “just browsing” segment, a lot of these issues can be resolved. In fact, many of them can be fixed purely through design changes. Let’s take a look at just 1 of 140 examples in our new checkout research study:
- 18% of US online shoppers have abandoned an order in the past quarter solely due to a “too long / complicated checkout process”.
- Now, our large-scale checkout usability testing shows that an ideal checkout flow can be as short as 12-14 form elements (7-8 if only counting the form fields).
- Yet, our checkout benchmark database reveals that the average US checkout flow contains 23.48 form elements displayed to users by default. (14.88 if only counting the form fields.)
In other words, nearly 1 out of 5 shoppers have abandoned a cart in the last quarter due to a “too long / complicated checkout process”, yet for most checkouts it’s possible to make a 20-60% reduction in the number of form elements shown to users during the default checkout flow. And again, this is just 1 of the 140 documented causes for checkout usability issues.
The Effects of Shopping Cart Abandonment: $260 Billion are Recoverable
If we focus only on checkout usability issues which we – during the past 10 years of large-scale checkout testing at Baymard Institute – have documented to be solvable, the average large-sized ecommerce site can gain a 35.26% increase in conversion rate though better checkout design. And that is despite testing the checkout flows of large ecommerce sites in the US and EU, such as Walmart, Amazon, Wayfair, Crate & Barrel, ASOS, etc.
If we look at the combined ecommerce sales of $738 billion in the US and EU, the potential for a 35.26% increase in conversion rate translates to $260 billion worth of lost orders which are recoverable solely through a better checkout flow & design.
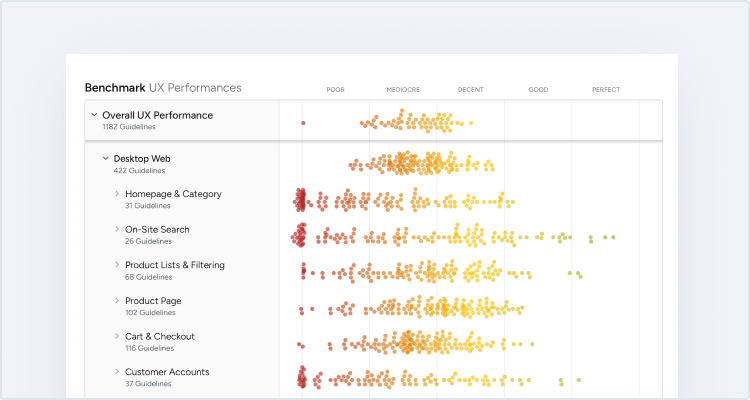
Now, achieving such gains won't come easy. But even when we audit leading Fortune 500 companies, who've already run a couple of checkout optimization projects, we find that major gains are still possible. And the potential is big: our benchmark of the checkout flows of 60 leading ecommerce sites show the average site has 39 potential areas for checkout improvements.
Learn more about our full checkout research findings.