Key Takeaways
- Users frequently sort by user ratings to find and compare items within product lists
- However, our benchmark shows that 64% of sites fail to include the number of ratings in the sorting logic, displaying ratings that many users mistrust at the top of the list
- Combining both the ratings average and number of ratings will better align sorted results with users’ preferences
One of the most popular ways users sort products is by user ratings, such as “Top Rated”, “Customer Ratings”, and the like.
Relying on the collective social wisdom that rating and review features offer helps streamline users’ quest for the right product; as one participant stated, “People have done the research for me”.
Yet Baymard’s e-commerce UX reveals that 64% of sites rely on a sorting algorithm that doesn’t align with how most participants use these ratings.
Baymard’s large-scale research into product lists and sorting shows that users often mistrust product ratings that couple a high average rating with very few ratings.
When sites prioritize products with high rating averages over those with a high number of ratings — or ignore the number of ratings altogether — the resulting product list fails to sort products as users expected, hampering product finding.
In this article, we’ll discuss Baymard’s Premium research findings for improving the sorting behavior of user ratings, including:
- Why the sorting logic for user ratings should not rely solely on the ratings average
- How to bolster users’ confidence in your site’s product ratings
Users Distrust Ratings Averages with Few Ratings

A 5-star average with only 1 rating is sorted above a 4.5-star average with 52 ratings on B&Q — despite users’ distrust of rating averages with low numbers of ratings.

Similarly, Costco sorts a 5-star average with only 1 rating above one with a 4-star average and 49 ratings, not taking into account how users question the rating averages that have very few ratings.
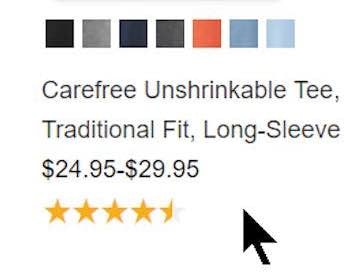
“So it’s not too meaningful when there’s only one review. You can’t always rely directly on those reviews.” Having sorted the list by “Customer rating”, this participant on IKEA wasn’t impressed with the 5-star average item sorted to the top with only 1 rating. He instead looked in more detail at the 4th item that had 4 ratings and also had a 5-star average.
Imagine you are at a UX industry conference and the conversation turns to newly released movies: only 1 of 20 people saw movie A and called it “spectacular”, but 18 of 20 caught movie B and found it “really quite good”.
If you are like most, you’ll factor both the qualitative and quantitative data into deciding which movie is more deserving of your hard-earned cash.
Yet, when sorting products by user ratings, some sites will position an item with a 5-star average based on one rating ahead of one with a 4.8-star average based on 18 ratings.
This rank order is technically correct when the logic only considers the ratings average, as the first product has a higher average rating.
However, nearly all users will find the first product to be a less trustworthy choice and are far more likely to explore the product with 18 ratings.
During testing, when confronted with a low number of ratings, most participants assumed that a small handful of perfect ratings was either coincidental or reflected some form of manipulation, such as shoppers being incentivized for their ratings and reviews.
In both cases, participants often found these rating averages highly questionable, whereas they did not question the reliability of averages based on higher numbers of ratings.
In practice, participants’ skepticism began to drop when the average was based on 5+ ratings, but some participants expressed a preference for even higher numbers of ratings (100+) before they would view the average as truly reliable, demonstrating how these users heavily rely on the number of ratings when analyzing rating information.
In fact, when test sites’ sorting option for user ratings only accounted for the ratings average, participants felt that the resulting order of the products was so untrustworthy that they often abandoned their initial sorting strategy as soon as they saw products with only a few ratings listed first.
After noticing these items at the top of the list, some participants falsely concluded that the site’s products overall lacked enough ratings, even when products farther down the product list carried 20+ ratings.
Many participants took only a couple of seconds to determine whether product ratings were “reliable”, leaving many worthwhile products sorted lower in the list unexplored.
The risk that this scenario occurs on mobile devices is even greater, where the narrow mobile viewport results in fewer items being visible in the product list at once.
Include the Number of Ratings in the Sort Order Logic


“What I’m looking at is not just the price but also the star rating, with the number of reviews it has…if it has a high star rating but has a low number of reviews, that’s not good, especially if I have never seen the chair before.” This participant on Amazon immediately sorted the product list by “Avg. User Review” (first image), and the resulting product order is clearly weighted by number of ratings as well as the overall average — note how a chair with a 4-star average of 3,226 ratings appears before a chair with a 4.5-star average of only 336 reviews (second image).


Sites like Overstock (first image) and Wayfair (second image) both have a sorting logic for user ratings that takes the rating average and number of ratings into account when determining the display sequence. Notice how products with lower averages but more ratings are placed above 5-star-rated products with fewer ratings.
Therefore, to better match user expectations and their intent when sorting by user ratings, ensure that the sorting logic takes into account the number of ratings and doesn’t rely solely on the average score.
This aligns much better with the weight users give to the number of people who have agreed on a given rating.
For instance, a product with a 4-star average based on 27 ratings and a product with a 4.5-star average based on 32 ratings should be placed before a product with a 5-star average based on only 5 ratings.
The best sorting algorithm is weighted to account for the combination of the ratings average and the total number of ratings, and many different implementation options exist to meet this goal.
While this method makes the actual sorting logic less transparent to the user (as it changes from simple high-to-low logic to a more complex equation), participants in testing generally grasped why some products with a higher average but fewer ratings were further down the list, and vice versa.
In contrast, the negative impact observed was tangible when the sites tested sorted products with 5-star averages first even when their average was based on just a handful of ratings.
Without this weighted logic, the most trusted products with a 4.5+ average based on a higher volume of ratings can be scattered across several pages of results that some users won’t take the time to scan.
A less sophisticated method is to specify the minimum number of ratings a product needs for its ratings average to be considered high-priority in the sorting logic.
For example, a ratings average would only be assigned to products with 5 or more ratings.
This logic ensures that products with a very low number of ratings will never display first even when their average rating is high.
Survey Findings on Numbers of User Ratings
To gain a more quantitative understanding of this bias towards products with a higher number of ratings at a slightly lower average, we tested different combinations of the two data points and compared the outcomes.
We conducted two surveys with 645 respondents split between them to test different rating averages versus the number of ratings.
Each survey showed the respondents two items from a product list and asked them to pick which one they would purchase.
We kept the price and product description identical — the only difference between the two list items was the ratings average and the number of ratings shown.
To avoid sequencing bias, we randomized the sequence of the answer options displayed for each respondent.

The first survey presented a low number of ratings for both a 4.5-star average and a 5-star average, with the results validating our qualitative findings.
For two otherwise identical products, where one product has a 5-star average based on 2 ratings, and the other has a 4.5-star average based on 12 ratings, 65% picked the one with the higher number of ratings despite its lower average.
This confirms the behavior observed during testing: when a perfect average was based on only 1–3 ratings, participants chose the product with a slightly lower average but a higher number of ratings.
The second survey presented participants with a higher number of ratings coupled with a lower rating average, and the results confirmed the bias towards the number of ratings when even more people gave the item a slightly lower rating.
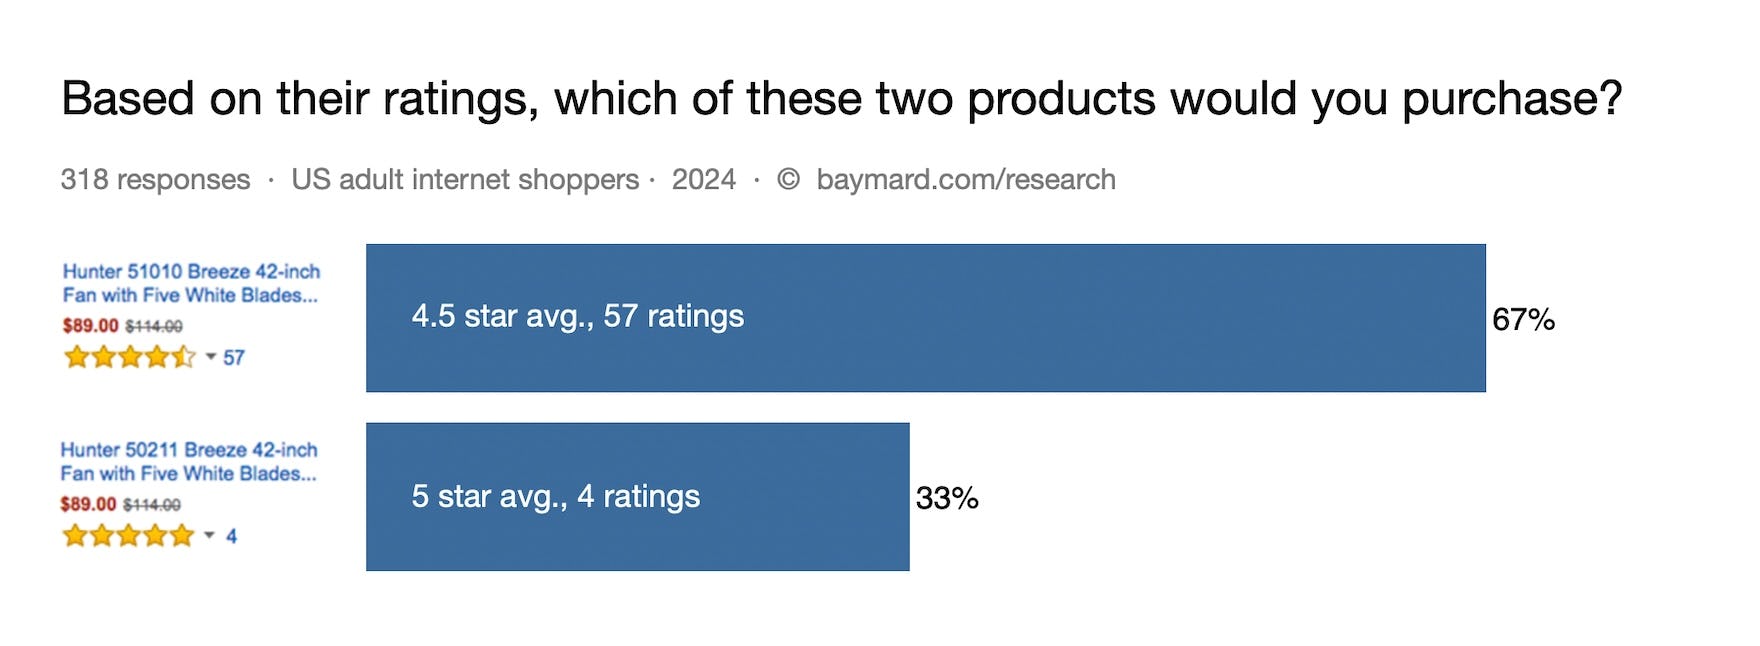
In this survey, respondents were asked to choose between a product with a 5-star average based on 4 ratings or a 4.5-star average based on 57 ratings.
As it turned out, almost the same percentage (67%) picked the option with the higher number of ratings.
Note that sites with a diverse user base should be aware that the level of bias may change based on demographics.
The survey results showed that among respondents aged 18–44, the bias towards a higher number of ratings was even stronger at 75%.
On the other hand, 57% of the respondents over the age of 45 chose products with the perfect 5-star average (i.e., they were much closer to an even distribution between the two options).
So, while we recommend that all sites perform split-testing to work out the best weighting between ratings average and number of ratings, this is particularly important for sites with a diverse user demographic.
Mind the Number of Ratings When Sorting User Ratings (Users Do)

At Amazon, four 5-star products with about 100 or fewer ratings are shown before several 4.5-star ratings with over 6,000 ratings; this sorting behavior places the products most users construe as “better rated” lower in the list.
Having decided to sort by user ratings, most users will likely be disappointed to find products with the highest average rating but few reviews above those with far more reviews and a slightly lower but still good average.
Unfortunately, and especially on mobile when users can only view one or two products at a time, they may quickly deem these items to be unpopular or too infrequently purchased to trust.
Along with following the UX best practices for designing user ratings and reviews, don’t underestimate the role your ordering logic plays in delivering the optimal sorting experience.
When presented with both a ratings average and the number of ratings, users rely on both data points to quickly identify and compare products that represent the crowd standouts.
It makes sense that the quantity of ratings carries weight in this sort of equation, as it adds a stronger signal that boosts the overall credibility of the ratings average.
Yet, 64% of sites in our e-commerce UX benchmark don’t include the number of ratings in the user ratings sort logic, leading to doubts about products that can result in a loss of sales.
To avoid this issue, ensure that when users sort by user ratings, the product list takes into account the number of ratings instead of relying solely on the rating average.
This article presents the research findings from just 1 of the 650+ UX guidelines in Baymard Premium – get full access to learn how to create a “State of the Art” e-commerce user experience.
If you want to know how your desktop site, mobile site, or app performs and compares, then learn more about getting Baymard to conduct a UX Audit of your site or app.