The Hidden Cost of Bad UX: How Much Revenue Are You Leaving on the Table?
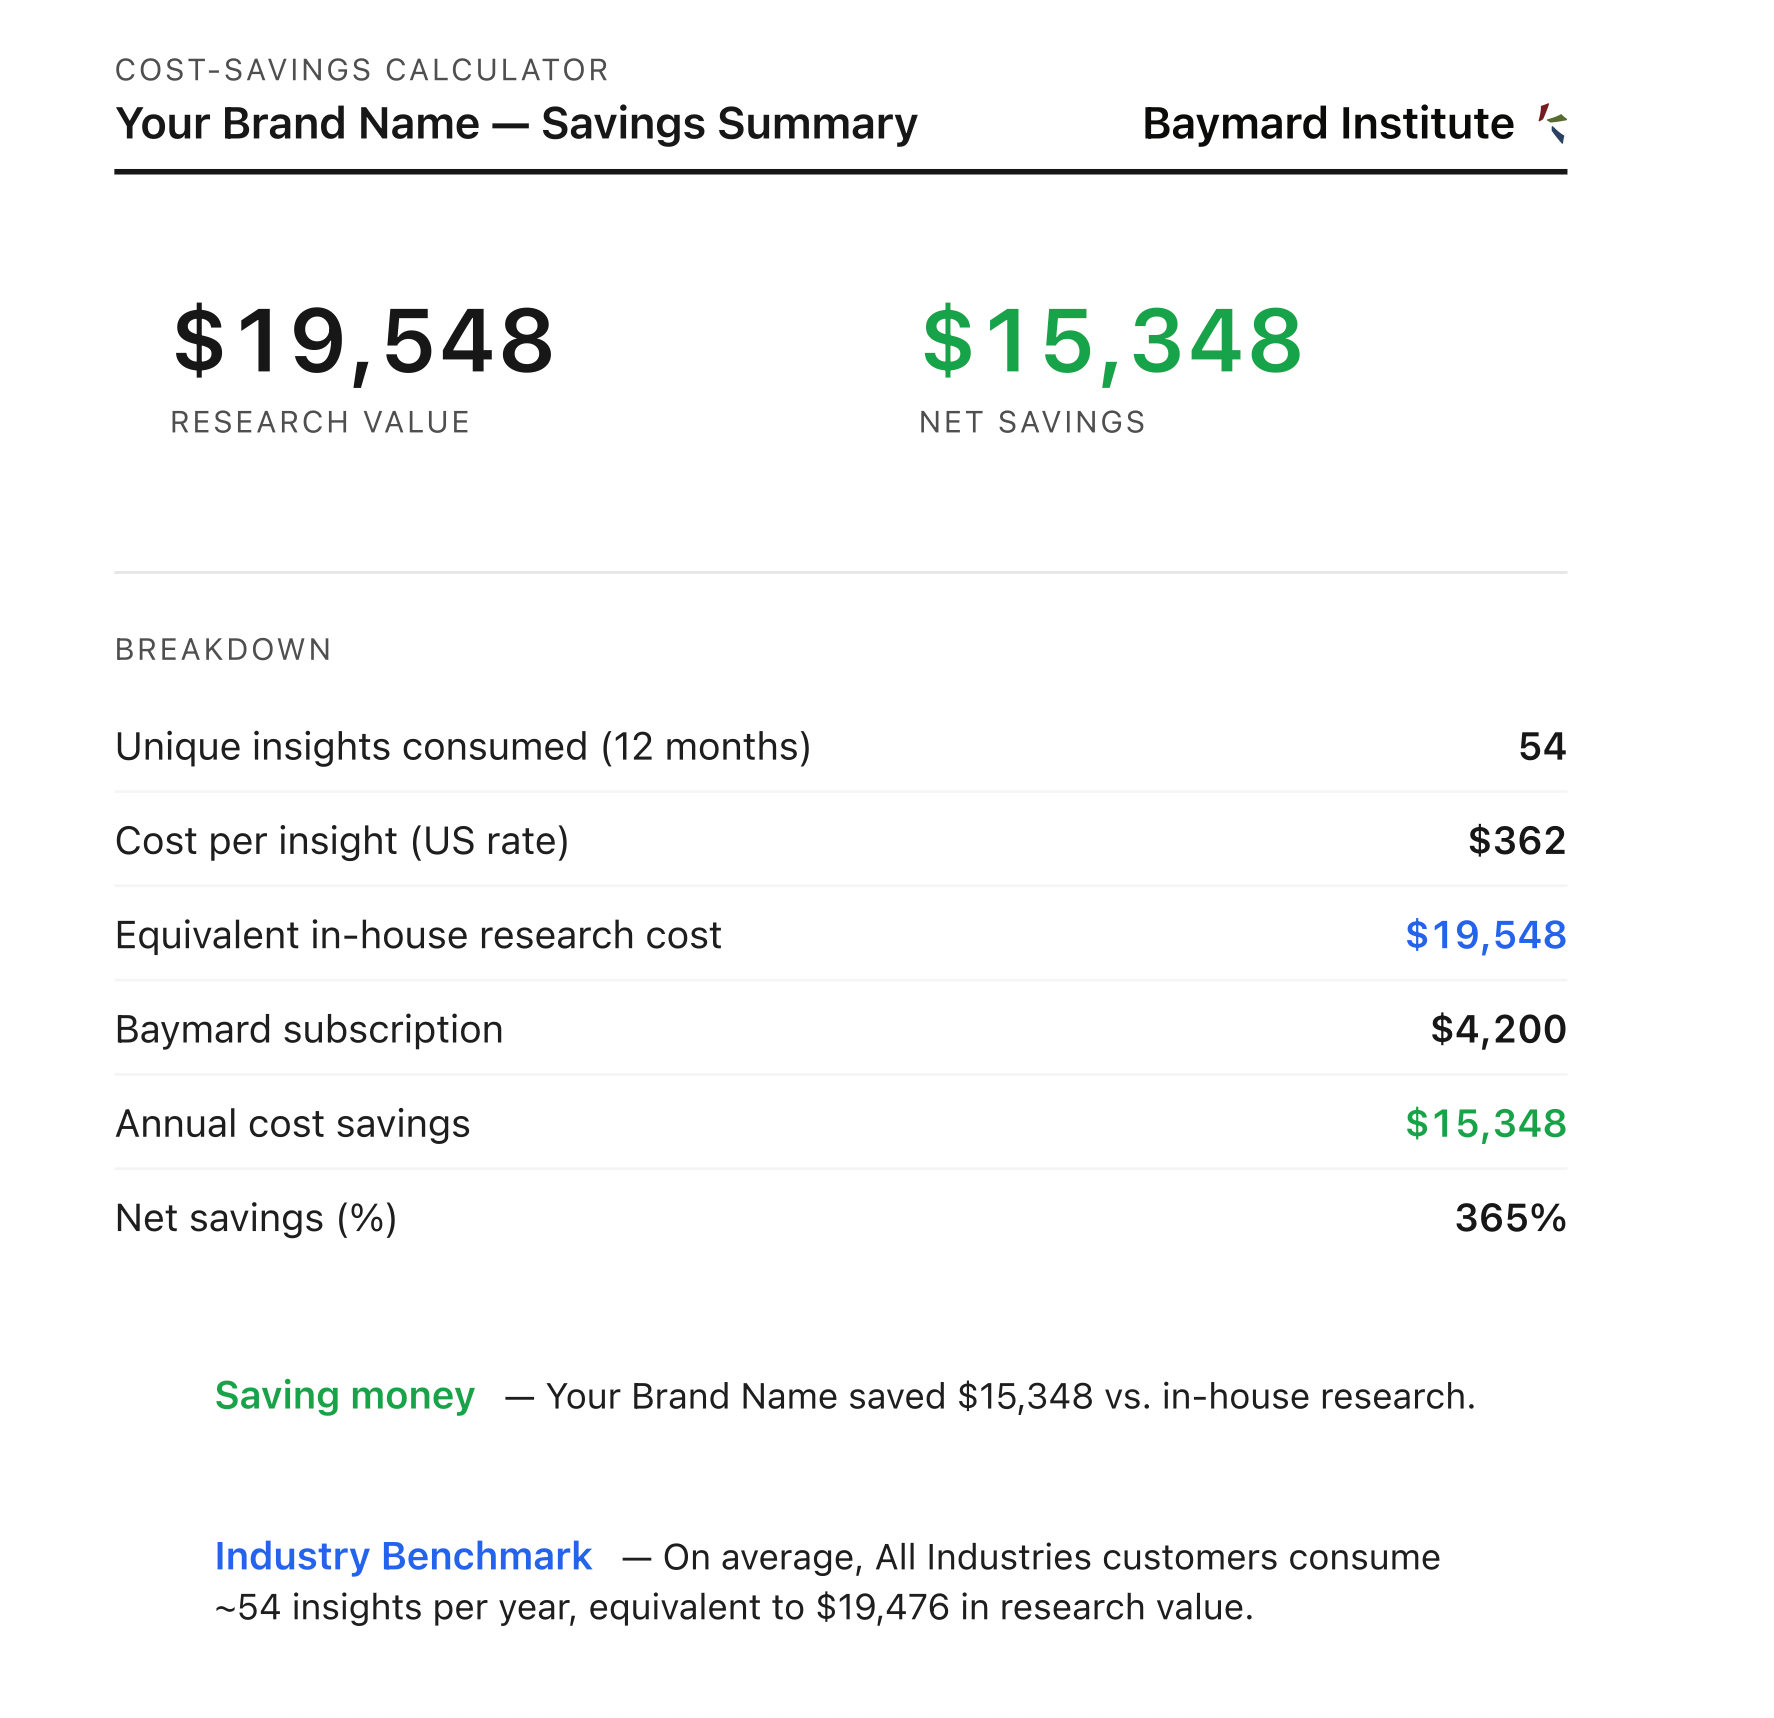
How much revenue is your site losing each month because of unnecessary UX friction? Find out what you could recover with Baymard's Opportunity Sizing Calculator.
How much revenue is your site losing each month because of unnecessary UX friction?
If you are like most ecommerce leaders or UX managers, you know that friction points across checkout, product pages, and navigation cause shoppers to abandon.
Yet, when competing for roadmap resources or budget approvals, UX research is often categorized as an internal software or subscription expense rather than a top-line revenue driver.
Without concrete financial estimates to back up your design priorities, critical usability improvements often get pushed aside.
To help you translate UX friction into clear commercial impact, Baymard has developed an Opportunity Sizing Calculator.
This tool converts Baymard's actionable user research into quantifiable projections, showing you the exact revenue you can unlock by systematically applying proven UX best practices to your site.
Moving from opinions to research-backed forecasting
Prioritizing a product roadmap often turns into a debate of subjective opinions, where the loudest voice in the room or the most senior person’s viewpoint takes priority.
UX designers and product managers must frequently advocate for critical usability fixes against competing internal requests, relying on qualitative arguments that struggle to secure executive support.
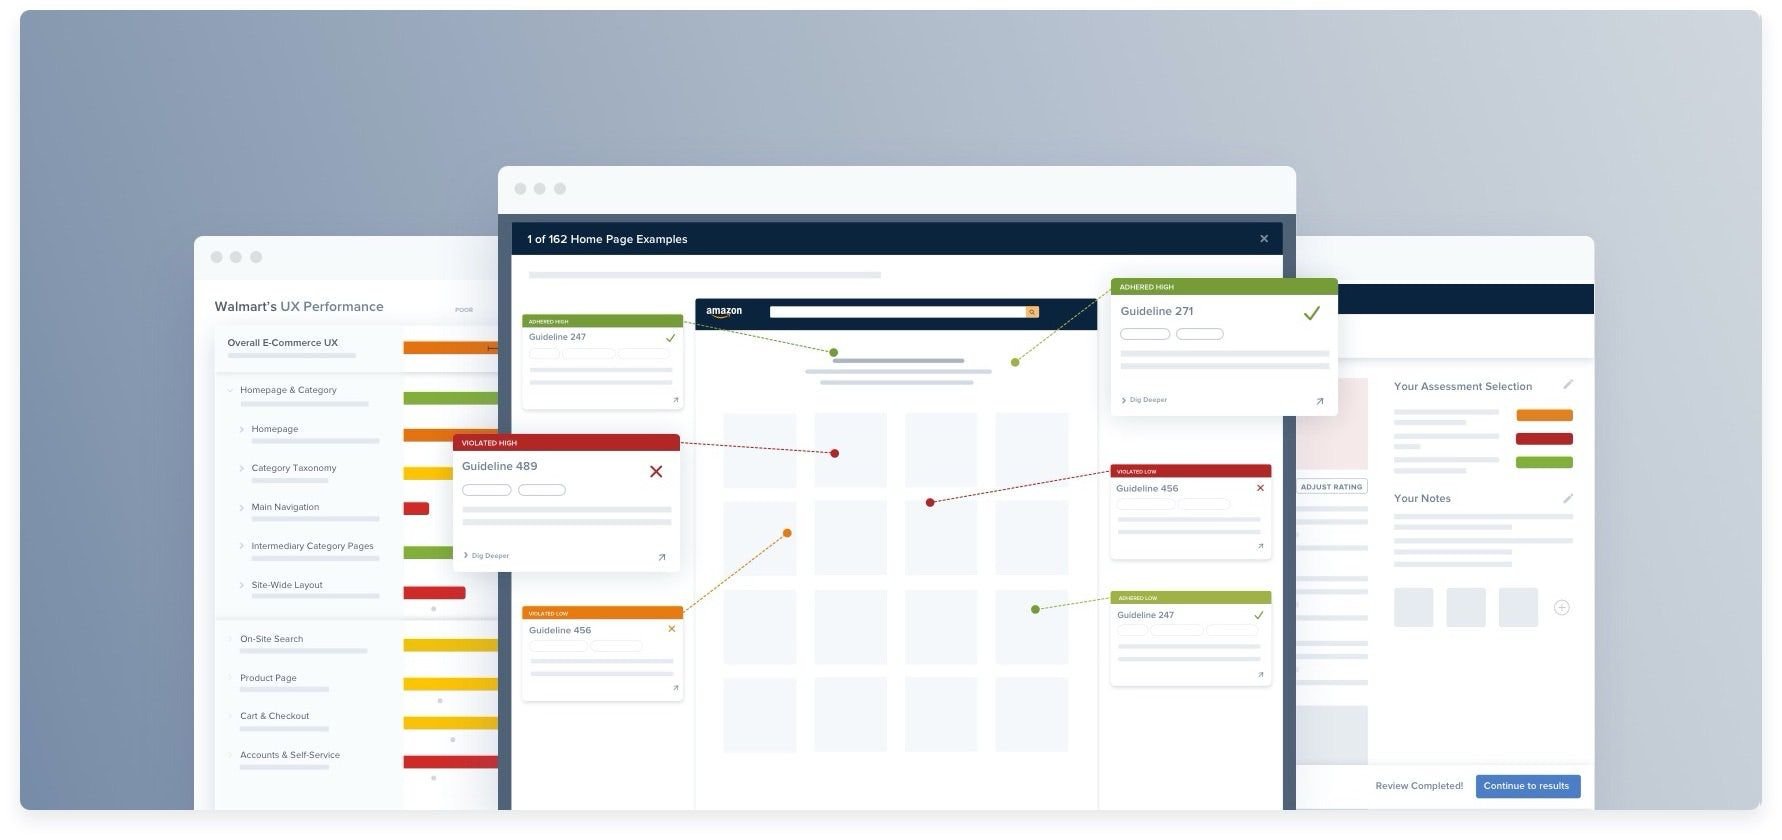
Baymard’s Opportunity Sizing Calculator bridges the gap between design priorities and executive decision-making, helping you secure buy-in.
This means you’re better able to:
- Connect specific usability insights directly to top-line revenue
- Build an unshakeable business case for leadership
- Give directors and VPs clear line-of-sight into the ROI of resolving site friction
Get your personalized opportunity metrics
Book a short call with our team and find out how much revenue you could recover with better UX.
What the calculator outputs reveal
Once your inputs are applied, the calculator provides clear projections broken down by total impact and site area.
- Annual recoverable revenue range: You will see a range (low, midpoint, and high) of annualized dollar value currently suppressed by UX friction
- Breakdown by UX theme: You can pinpoint where the largest financial gains are (for example, in checkout design, mobile navigation, or product detail pages)
- Plan tier impact: The output illustrates how expanding your access to additional Baymard guidelines unlocks cumulative revenue potential across your roadmap
How the Opportunity Sizing tool calculates recoverable revenue
The calculator projects potential conversion lifts by applying parameters derived from 200,000+ hours of UX testing across 40+ ecommerce industries.
Business performance inputs
To generate a baseline projection, the calculator evaluates your site's monthly traffic alongside one of two standard performance metrics:
- Option A: Revenue per Visitor (RPV)
- Option B: Average Order Value (AOV) combined with Conversion Rate (CVR)
The tool also takes into account your industry to anchor the calculations to relevant benchmark data.
Standardized guideline scoring
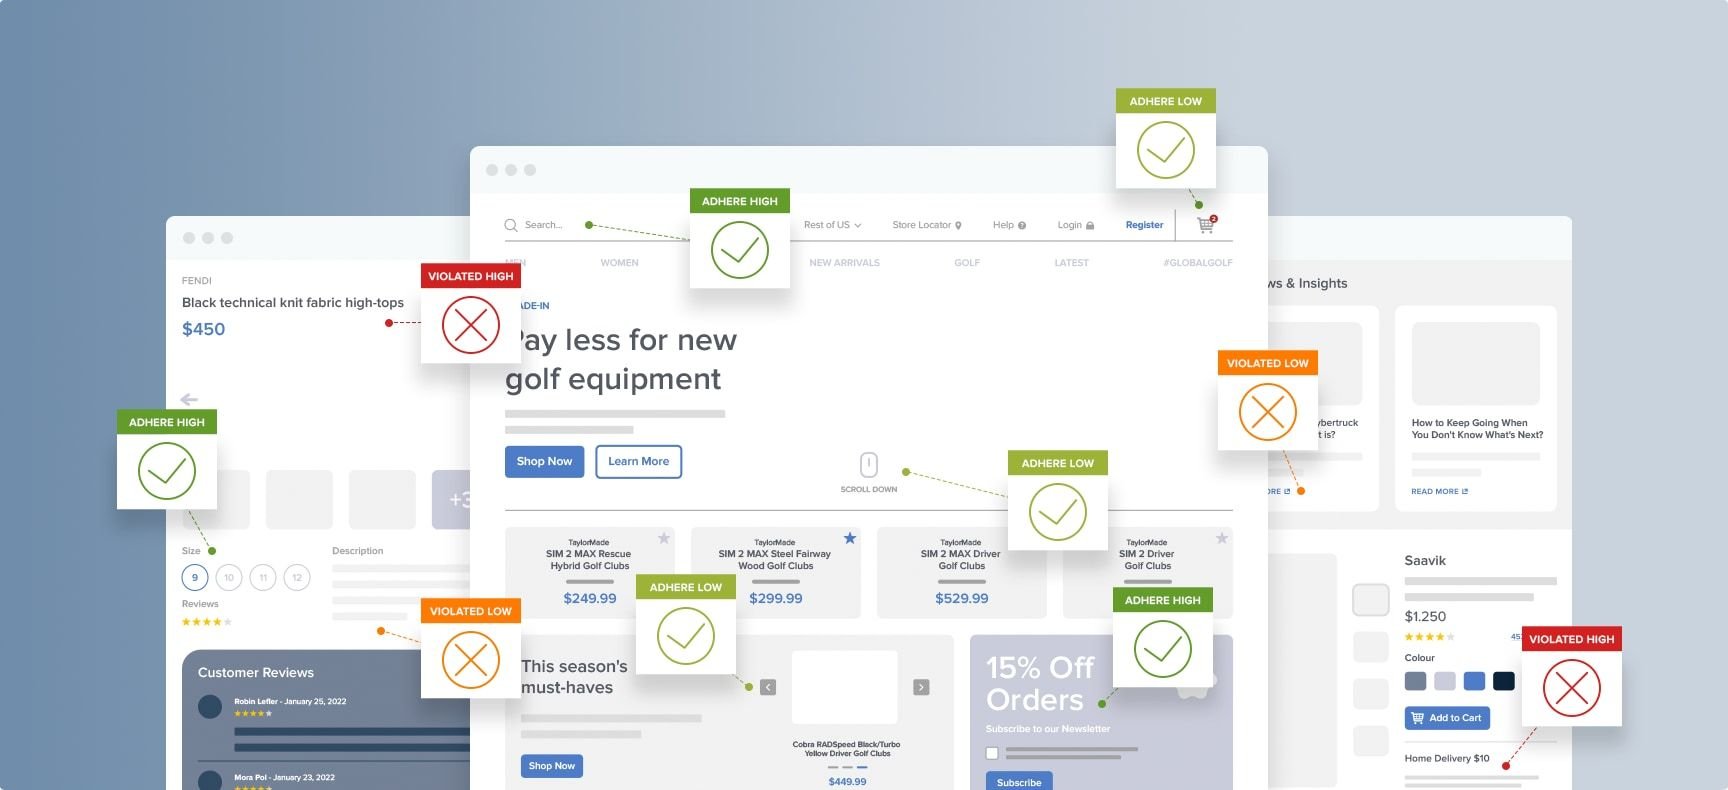
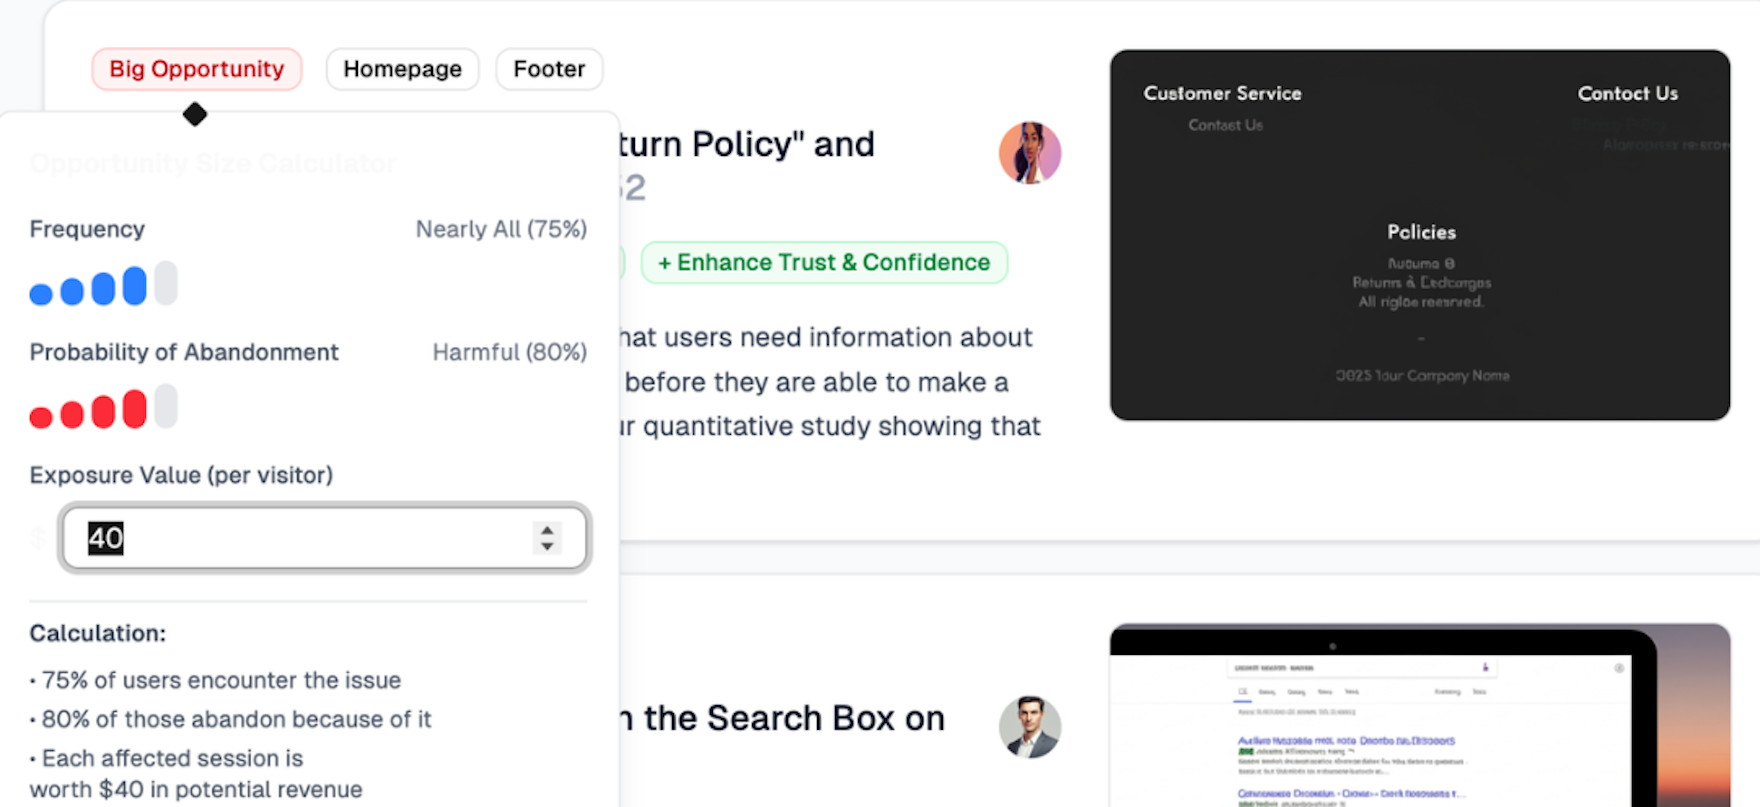
Every UX best practice guideline in Baymard's catalog carries an estimated lift based on two core factors:
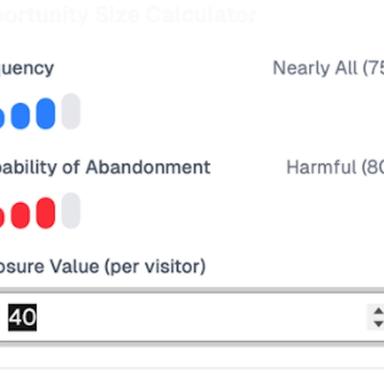
- Frequency of encounter: The percentage of users who interact with the problematic UI component
- Severity of friction: The conversion impact observed during user testing when a site violates the guideline
Quantifying the individual guideline allows us to quantify the opportunity size for each UX theme, and for each Baymard subscription plan.
That means we can help you decide on the best plan for your team and organization, and show the ROI you can expect from implementing best practices available within that plan.
Compounding fixes with diminishing returns
Fixing two separate UX issues on a website does not produce simple additive results.
For example, resolving an issue in the cart improves the baseline performance of the site, and any subsequent fix in the checkout flow operates on that newly improved baseline.
The calculator applies a compounding model to reflect diminishing returns, ensuring that combined projections remain mathematically grounded rather than artificially stacked.
Applied revenue caps
Even a complete overhaul of every UX issue will not double a site's conversion rate overnight. There is a practical ceiling to the impact of usability improvements alone.
To maintain realistic financial projections, the methodology applies standard cap models to total revenue lift, preventing the opportunity size from being overinflated:
- Conservative (low): 15% revenue lift cap
- Baseline (midpoint): 25% revenue lift cap
- Aggressive (high): 35% revenue lift cap
Find out how much revenue your site is leaving behind
Leaving standard UX best practices unaddressed directly suppresses your revenue performance.
Stop guessing what drives conversion, and get the dollar values to back up your design recommendations.
Book a short call with our team to run your metrics through the Opportunity Sizing Calculator and get a personalized report for your site.
Weekly UX Research, Insights, and Updates
Join 60,000+ UX professionals. Get the latest UX research, practical guides, and Baymard news delivered to your inbox every week.
Loading...