Key Takeaways
- Shoppers for digital services are “information hungry” and need detailed, transparent content before feeling confident enough to try or buy
- When key details about the platform experience, features, pricing, and integrations are hard to find on SaaS marketing websites, users often hesitate and delay decisions
- 7 research-backed SaaS UX strategies will fix common issues, helping SaaS providers better surface the information users need
Key Stats
- 20% of SaaS sites fail to showcase their UI effectively
- 33% of SaaS sites fail to provide dedicated industry pages
- 44% of SaaS sites struggle with plan matrix usability
- 93% of SaaS sites don’t always link from plan matrix features to associated feature pages
Digital Subscription (aka SaaS) ecommerce websites operate differently from traditional online stores, with smaller product catalogs focused on plan levels or service packages rather than physical goods.
As Baymard’s testing confirms, this reduces the need for complex navigation or search, shifting the emphasis to feature pages, use case breakdowns, and detailed pricing comparisons.
In contrast to shoppers at traditional ecommerce sites, users considering digital subscription services tend to need a thorough and holistic view of a service before signing up.
Given these differences, SaaS marketing websites must carefully optimize their page designs and plan matrix to align with how users evaluate and make decisions.
This article features 7 research-backed SaaS UX fixes for common problems across SaaS marketing sites, which will help users to successfully:
- Preview the look and feel of the service
- Verify support for a specific industry
- Evaluate a plan matrix
- Review application integrations
Within each of these topics, we will illustrate how to solve common pain points with best practice examples from leading SaaS sites and apps, drawing from Baymard’s research findings and benchmarking.
Preview the Look and Feel of the Service
When evaluating a digital subscription service, users want more than feature lists and pricing — they need to see the interface they will be using.
Large-scale testing of SaaS marketing websites finds that many participants actively seek out UI visuals, with some prioritizing them over text descriptions.
Without a clear visual preview, potential customers may leave, feeling uncertain about the quality of the service’s user experience.
Yet, our latest benchmark reveals roughly 20% of SaaS sites still fail to showcase their UI effectively, risking handing over conversions to competitors.
This first fix ensures users have a sound understanding of the experience that will come with the purchase.
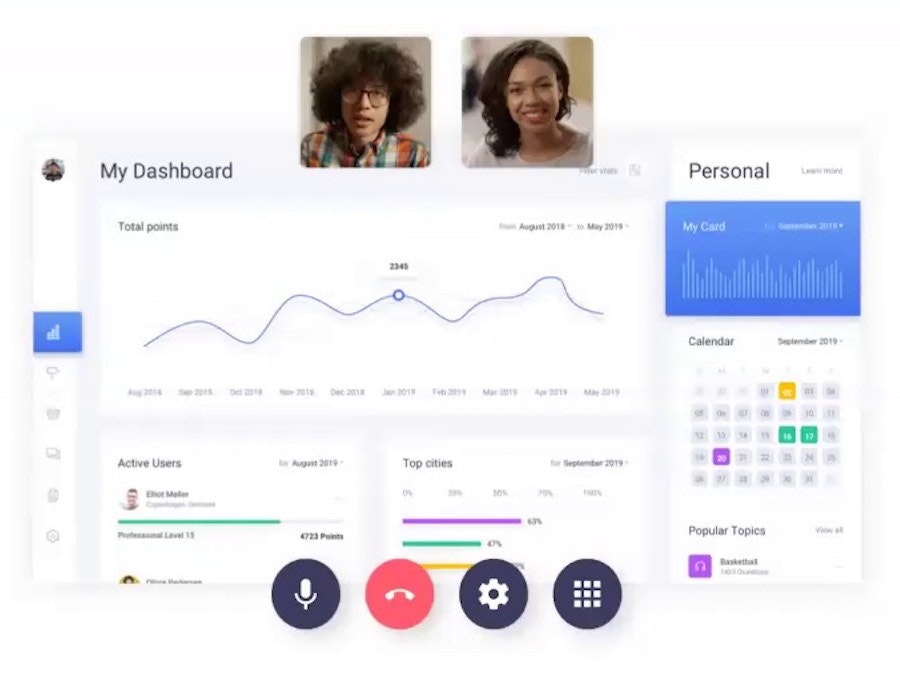
1) Showcase the Service UI and Experience

A collage of screenshots from Basecamp’s UI helps prospective buyers know what experiences to expect.

Similarly, Grammarly uses a screenshot to illustrate how its real-time editing feature works.
High-quality UI visuals are essential for helping users evaluate your service.
Testing shows that seeing the interface is especially useful when comparing SaaS options, particularly for those unfamiliar with the brand or product.
A visual preview gives users a strong starting point before diving into features, plans, or pricing.
The most effective formats include the following:
-
Images showing actual screenshots of the actual UI (versus graphical representations of it)
-
Animated GIFs highlighting dynamic features and interactions
-
Videos showcasing the user experience, but only after an appropriate number of images have been provided
-
Interactive demos allowing prospective customers to use the service in a sample environment
UI visuals should be highly visible and distributed throughout the site versus being sparsely used.
Testing shows that placing UI images near the top of the homepage quickly engaged participants and encouraged deeper exploration.
And while homepage visuals provide a general introduction, you’ll want to showcase more detailed UI elements and interactions on relevant feature pages.
Verify Support for a Specific Industry
Without industry-specific use cases called out, many users may assume a service won’t meet their needs and research other competitors instead.
SaaS usability testing confirms that participants want to know how a service fits into their daily workflows, but vague descriptions made this difficult.
Still, our latest SaaS UX benchmark reveals that 33% of sites failed to provide dedicated industry pages to help users verify the service would be a suitable match to their industry.
This next fix resolves the ambiguity about whether the service is a suitable match for a certain business segment or size.
2) Create Dedicated Industry Pages


At Xero, prospects can navigate to a list of Xero solutions by industry (first image), and find dedicated pages that speak to each use case (second image). These dedicated pages provide extra reassurance that the service is optimized to meet these specific needs.
Many users evaluate a service through their unique work context — education, finance, healthcare, retail, and so on — and sites that highlight industry-specific applications tend to perform better.
After understanding a service’s core features, users naturally gravitate toward industry use cases, which significantly increases their likelihood of subscribing or trying the service.
While creating detailed industry pages takes effort, they serve as powerful sales tools by helping hesitant users see exactly how the service benefits their specific professional needs.
Evaluate a Plan Matrix
Every site in our latest benchmark includes a pricing page, underscoring its importance in helping users compare plans.
Nearly all use a plan matrix, the most effective format for evaluating subscription options.
However, 44% of sites tested performed mediocre or worse on the usability of a plan matrix, so it is unsurprising that testing reveals that participants struggle most with it.
Unclear or ambiguous features — especially those critical to a user’s business or exclusive to higher-priced plans — can delay or prevent decisions.
And, when finding information in the matrix becomes difficult, it can lead users to assume some features are unavailable.
The next 4 fixes solve some of the more egregious plan matrix issues found on SaaS platforms.
3) Explain Features Within the Plan Matrix


Many users struggle to understand the features listed in a SaaS plan matrix, often requiring assistance to interpret common terms.
Even seemingly straightforward labels like “user” for cloud storage or the difference between a “host” and a “participant” in online meetings can create confusion.
By not fully describing terms and features in a plan matrix, 20% of sites tested assumed users can intuit the domain jargon, which is rarely the case.

At Avast, each feature listed in the plan matrix comes with a description available through a tooltip, progressively disclosing explanations right where users need them.

Verizon, on the other hand, describes each feature directly on the page and provides the key details users require to understand them.
Instead, employ these 2 best practices:
-
Offer easy-to-view explanations of each feature to make plan comparison easier and more effective.
-
Consider using interactive elements like tooltips that allow users to access additional details without cluttering the already lengthy plan matrix page.
Testing shows that, on average, these pages contain 40 features across various domains, making it highly unlikely any user would understand them all.
Forcing users to leave the plan or search elsewhere for answers adds unnecessary friction, and if they ignore unfamiliar features, it can lead to missed opportunities.
To keep users on the page and fully informed, provide visible explanations or those accessible via interactive components.
4) Link from Plan Matrix Features to Feature Pages


Xero offers links from the features in the plan matrix (first image) directly to dedicated feature pages (second image), allowing users to drill down for more details about each feature without the need for searching.
Despite having in-depth content about certain features elsewhere on their sites, 93% of sites tested failed to consistently link those pages to the corresponding features in the plan matrix.
Some participants never found the additional content, while others had to interrupt their evaluation process to search for it, sometimes spending several minutes before locating the right information.
The result is a frustrating experience that can lead to missed sales, as users may abandon the site or overlook features that could influence their decision.
A simple solution is to link each plan matrix feature directly to its corresponding content page, whether it’s a dedicated “Features” page, a support article, or a detailed product breakdown.
These links can be embedded in tooltips or applied to the feature text itself, ensuring users can quickly access deeper information without extra work.
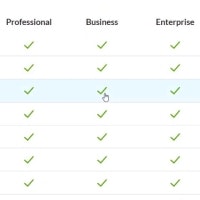
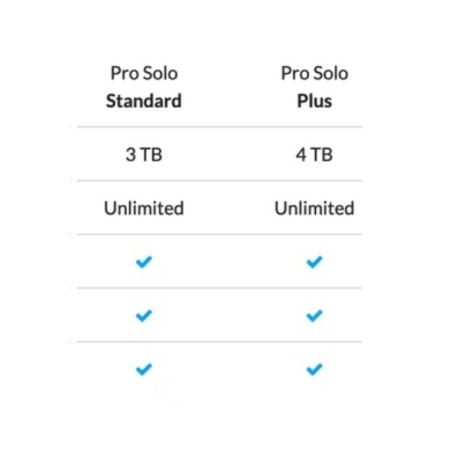
5) Display the Full List of Features in the Plan Matrix

Shopify’s plan matrix hides some of the available features, making it likely some prospective customers will miss the non-emphasized button at the very bottom required to access them.

Similarly, McAfee truncates its feature list and requires prospects to spot the call to action at the bottom of each column, which can be unreliable.
On average, SaaS plan matrices include around 40 features, making it tempting to truncate the list for a cleaner appearance; however, doing so caused issues in testing.
Yet, 25% of test sites hid features behind a “View More” link, which often led participants to overlook them entirely, even when the link was prominently displayed.
As a result, some participants mistakenly assumed that a truncated feature list was complete, leading them to believe a service lacked key functionality and ultimately abandon the site.


At Adobe, users can scroll down the plan matrix to view the entire list of features. Adobe also uses a “sticky header row” feature to keep the plan names and details in view when users scroll to view the lengthy list.
Given the risk of users missing critical features and dismissing a service prematurely, SaaS sites should display the full list of plan features upfront.
Providing full visibility ensures users see the plan matrix as a complete resource, reinforcing its role as the primary tool for evaluation and comparison.
Testing confirmed that participants found fully displayed feature lists easier to navigate, reducing friction and improving decision-making.
Moreover, showing all features can positively influence users’ perception of a plan’s value, emphasizing the breadth of functionality offered.
Any concerns about overwhelming users with too much information can be mitigated by designing the matrix for easy scanning, using clear typography, spacing, and grouping.
6) Create a Highly Scannable Plan Matrix


Canva offers an easy-to-scan list of the types of features it supports (first image) and then progressively discloses a list of specific features for each set. Users can quickly scan the big-ticket features before digging into more granular lists of functionality.
During testing, participants spent most of their time evaluating SaaS plan matrices, making them a key factor in subscription decisions.
However, these matrices are often dense, text-heavy tables that can make locating relevant details difficult — an issue present in 15% of sites tested.
When poorly structured, users must spend unnecessary effort scanning for information, increasing frustration and the likelihood of overlooking key features.
Missed details can lead to unanswered questions, confusion, and, ultimately, abandonment of the plan or the site altogether.
Testing reveals 5 ways to design plan matrices to be easy to scan:
-
Group related features under clearly labeled subheadings
-
Order groups of features by importance
-
Persist plan headings and feature subheadings during scrolling
-
Scale the matrix for optimal display
-
Use horizontal styling to define rows
A well-structured plan matrix allows users to focus on evaluating plans instead of searching for essential details — leading to better engagement and higher conversions.
Review Application Integrations
Users often depend on specific applications to do their work and need to know whether a service integrates with them.
Many SaaS platforms provide an “App Integrations” page, but if it’s hard to find, users may wrongly assume their required apps aren’t supported.
In testing, some participants were deeply reliant on specific apps and were highly motivated to confirm whether an integration was available for them (e.g., “This needs to integrate with Slack because my whole team’s on Slack”).
This last fix ensures that any integrations your service offers are discoverable.
7) Ensure App Integrations Are Easy to Find


Testing reveals 3 key locations where links to the “App Integrations” page should appear: in the main navigation, in the footer, and from the homepage.
Since integrations are a critical factor in decision-making, users expect a direct link in the main navigation alongside other essential sitewide links.
The footer is another key location, as users often instinctively check it when searching for specific information.
Adding a link on the homepage ensures users immediately recognize that integrations are available, giving them quick access to more details.
Give Users What They Need to Confidently Commit to a Service

Here, Dropbox features its user experience with application screenshots while also guiding prospective customers to specific use cases to start their journey.
Our latest benchmark of Digital Subscription (SaaS) ecommerce sites reveals plenty of opportunity to place yourself ahead of the competition and provide real value to prospective customers.
Despite testing multimillion-dollar sites, we saw participants repeatedly abandoning them due to SaaS UX design issues with layouts, content types, or sales page features.
Thus, focusing on these 7 UX SaaS fixes across your marketing website is clearly worth the investment:
- Showcase the service UI and experience
- Create dedicated industry pages
- Explain features within the plan matrix
- Link from plan matrix features to feature pages
- Display the full list of features in the plan matrix
- Create a highly scannable plan matrix
- Ensure app integrations are easy to find
Implementing these recommendations helps users better investigate, understand, and compare digital subscription services, increasing their confidence when it comes time to make the decision to subscribe.
Getting access: all 170+ Digital Subscriptions & SaaS Website UX guidelines are available today with Baymard access. (If you already have access through an account, open the Digital Subscriptions & SaaS study.)
If you want to know how your SaaS desktop or mobile website performs and compares, then learn more about getting Baymard to conduct a Digital Subscriptions & SaaS UX Audit of your site.