Key Takeaways
- Our 2026 Mobile ecommerce UX benchmark shows that the average mobile site’s UX performance is “Mediocre”
- Only one site is rated as having a “Good” UX performance, while none are rated as “Perfect”
- Follow these 10 mobile ecommerce UX best practices to improve your mobile site’s UX performance
Key Stats
- 71,000+ manually reviewed and rated UX elements
- 150+ mobile ecommerce sites benchmarked
- 56,000+ mobile ecommerce examples available for both inspiration and for knowing what to avoid
Mobile accounts for the majority of ecommerce traffic on most sites, generating around three quarters of retail store visits.
It’s therefore key that mobile ecommerce sites perform well for users.
However, Baymard’s 2026 benchmark of mobile ecommerce UX provides a stark finding: the vast majority (75%) of mobile ecommerce sites are only “Mediocre” when it comes to ecommerce UX.
Moreover, nearly all (95%) of sites are either “Mediocre” or “Decent”, and only 1 site is rated “Good”.
This Mobile UX benchmark is based on our in-depth Baymard research findings and includes 71,000+ mobile site elements that our team of UX researchers has manually reviewed and rated.
We’ve also categorized over 56,000 new best and worst practice Mobile UX examples from 150+ leading ecommerce sites across the US and Europe (with performance verified).
Note that the sites in our benchmark are the biggest sites that commonly have large budgets for UX improvements — indicating that the problem is likely even worse for smaller mobile ecommerce sites.
In short, the benchmark — based on our extensive mobile research — indicates that an average site will fail at some point to meet a user’s UX needs.
Consequently, the average mobile user will at best struggle to complete their task or spend more time than is necessary completing it.
Worse, some users will fail completely, abandoning the site and their intended purchase.
As a starting point for improvement, in this article we provide 10 mobile best practices that if implemented can improve a site’s mobile ecommerce UX performance.
1) Combine Variations of Products into One List Item (42% Don’t)


“It is a little weird too…Like I just noticed, I’ve scrolled all this far down, and they may only have like four products, but they’re making it seem like there’s more, [with] all these colors. So in the back of my head I kind of think I’m wasting my time.” A participant browsing the “Sale” listings at Nicce became suspicious of the site when he realized that he was looking at different colors for identical products.
During multiple rounds of testing it became clear that there are two major usability issues associated with product variations displayed as separate list items:
- Product lists can become cluttered with variations of products, overwhelming users and making it harder for them to get an overview of the product range
- If the variations are spread throughout the product list, many users will struggle to find a particular variation of a product

“Okay, it’s good that they have all the color variants shown right below the dress. So if I like some dress and if I know that there are variations I can just go on that and see them without opening it — that saves time.” Combining color variations into a single list item can save a lot of time, as this test participant on the German site Bonprix confirmed during large-scale European testing.
On the other hand, when product variations are combined, product lists contain only unique products.
This helps users get an overview of products more easily.
Additionally, users are far less likely to overlook a variation that would suit their needs.
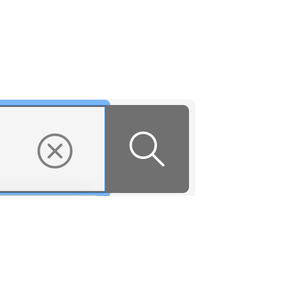
2) Always Provide a “Submit” Button Adjacent to the Search Field on Mobile (27% Don’t)

“Kind of a weird search function.” This participant searching for restaurants on Uber Eat’s mobile site was temporarily delayed by the lack of a clear search submit button, eventually realizing she needed to use the keyboard “Return” button.
When searching for products on mobile websites, users won’t always look towards the touch keyboard to submit their search queries.
Indeed, during our large-scale mobile usability testing, some users would mainly look to the webpage UI itself at first, therefore failing to notice or recognize the touch keyboards’ search submit button provided by the mobile OS.
These users will often go on a major detour and experience severe frustrations over the seemingly basic action of submitting a typed search query (see guideline #944).


Both IKEA (first image, Android) and Home Depot (second image, Android) provide search “submit” buttons, leaving users in no doubt as to how to proceed once the search terms are entered in the box. Note also how the keyboards that display when the search boxes are activated include blue “search” buttons, making it easier for users that prefer submitting search terms using these keyboards to know where to tap.
Therefore, position an explicit search “submit” button directly in the UI adjacent to the search field.
Having a search “submit” button aligns with users’ expectations and, therefore, streamlines the search process, including initial search query submission as well as iterative search refinements.
Combining the use of a touch keyboard optimized for “search submit” with a search submission button directly in the UI helps to ensure an intuitive and efficient mobile search experience, regardless of the user’s favored method for submitting a search query.
3) Always Allow Users to Navigate across User Reviews via Reviewer-Submitted Images (57% Don’t)


“And so [when I try to scroll] it’s just showing me the same picture. I like when it will show you more pictures.” At Article, this iOS participant clicked into the images within the individual reviews (first image), expressing frustration that she couldn’t view the 50+ available reviewer-submitted images within the same overlay (second image) like she could on a previous site.
Many users like to move through reviews quickly, scanning and skimming for the information they seek across a set of reviews rather than focusing on a single review at a time.
Some use a similar approach with reviewer-submitted images, wanting to rapidly peruse all the uploaded visuals to inspect or confirm specific details or patterns.
Yet our testing reveals that many sites constrain users to navigating only the images within a single review, frustrating users with the extra work required to see these critical product visuals (see guideline #2554).


“I like when they do this, how you can slide in the pictures, and go from one review to the next, and just see all the reviews that include pictures. I do like when they do that.” This iOS participant at Lamps Plus gave a gasp of delight when she swiped on the image of the chair in a flowered print (first image), and was taken to a photo from a different reviewer (second image).
Thus, users should be able to progress through all user review images at once.
In particular, participants appreciated when clicking on an image within a review launched an overlay with an image carousel, allowing them to move directly through all the images submitted with customer reviews.
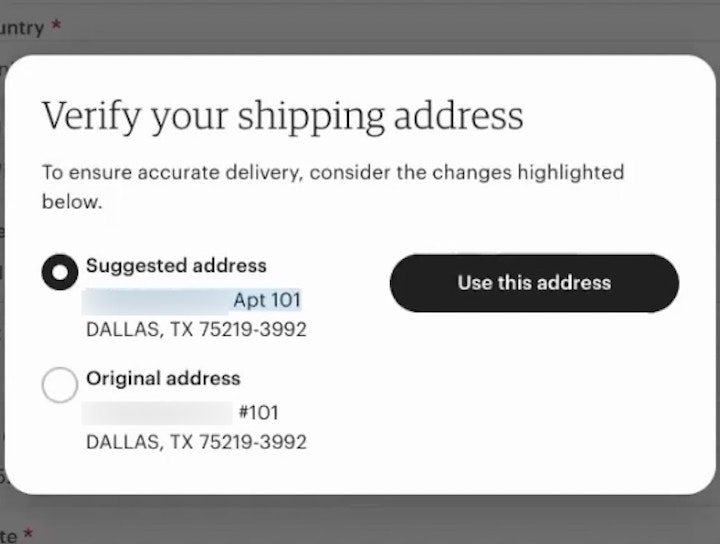
4) Have an Address Validator or Address Lookup Feature (54% Don’t)


ECS Tuning (first image), Netonnet (second image), and Menards (third image) all allowed users to continue through checkout despite entering an address with misspellings or other errors — risking delivery problems down the line.
Inaccurate addresses cause multiple, cascading issues (see guideline #625).
Users may have problems receiving their orders, or not receive them on time — or not receive them at all.
Sites have to provide extensive customer support when there are delivery issues and often also face broken customer experiences — and the consequent negative site reviews — with the end result being a lost sale due to a returned, undelivered order.

”I like that. It lets you know what you’re doing…especially if you’re buying something in a hurry — [there’s] somebody around you, you’re distracted — it allows you to quickly change it.” The address validator at Musician’s Friend (iOS) caught multiple address errors for this participant, including typos in the street name and ZIP code.
Address validators function by querying an address database (e.g., the USPS) to ensure that the address the user typed matches the address the postal service has on file.
While not perfect, address validators allow sites to perform a basic verification of a user’s typed address, helping ensure there are no problems delivering orders.
For instance, mobile testing showed that, due to keyboard autocorrect and the difficulty of typing on a small touch keyboard, users make errors far more frequently when entering their address on mobile devices.
Furthermore, users on mobile devices have more difficulties noticing errors due to the lack of page overview caused by the small screen.
Therefore, to prevent such severe issues, sites that ship physical products should always integrate an address validator into the “Shipping Address” step of checkout.
5) Use “Adaptive Messages” for Validation Errors (93% Don’t)

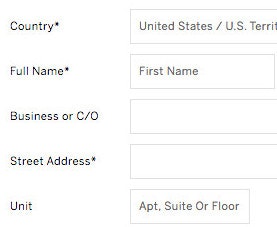
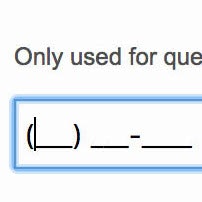
This generic error message at GameStop suggested that the issue was that users hadn’t entered a phone number — whereas the real issue was that the phone number was incomplete and didn’t have enough digits to be valid.
Even when taking logical steps to minimize the number of users who run into validation errors — for example, indicating both required and optional fields, providing explanatory text, and showing input masks — some degree of error messaging will be unavoidable.
In the worst scenarios, participants in testing were unable to resolve the issue, preventing them from continuing due solely to vague or generic error messages, and ultimately forcing them to abandon the process (see guideline #722).
As a result, overly general error messages force the burden of determining what the problem is — and what needs to happen for the issue to be resolved — onto users, turning what may have been merely a small speed bump into a major roadblock.

During testing at Lowe’s mobile site (iOS), this participant received a specific error message that helped him quickly find the issue with his address entry.
To give users the clearest indication of the issue and how to resolve it, sites should instead use “Adaptive Error Messages”.
Rather than providing the same generic message for all validation errors, “Adaptive Error Messages” change depending on the exact subrule that invoked the validation error, using this detail to provide the user with instructions on how they can correct their input.

The error message at Away clearly communicates the precise issue with the card number — ”Your card number is incomplete” — rather than a more generic message like ”Your card number is invalid”.
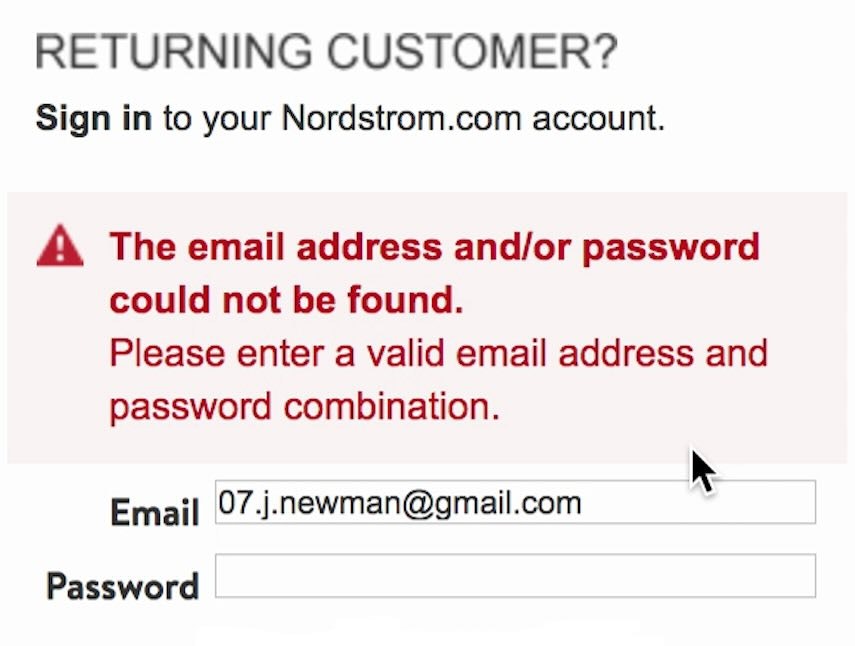
In other words, “Adaptive Error Messages” dynamically change to best match the user’s situation — for example, if a user inputs “john.newman@gmail” in an email field, an adaptive validation error message would read, “This email address is missing part of the domain (such as ‘.com’).”, whereas if they had typed “john.newmangmail.com” the message would read, “This email address is missing the @ character”.
While it’s possible to write specific microcopy for up to 160+ error messages for a single form field, testing showed that specifying at least 4–7 messages for the most complex inputs — like site-specific or unconventional form fields, card number, cardholder name, security code, password, phone, and email — goes a long way towards improving the error-recovery process.
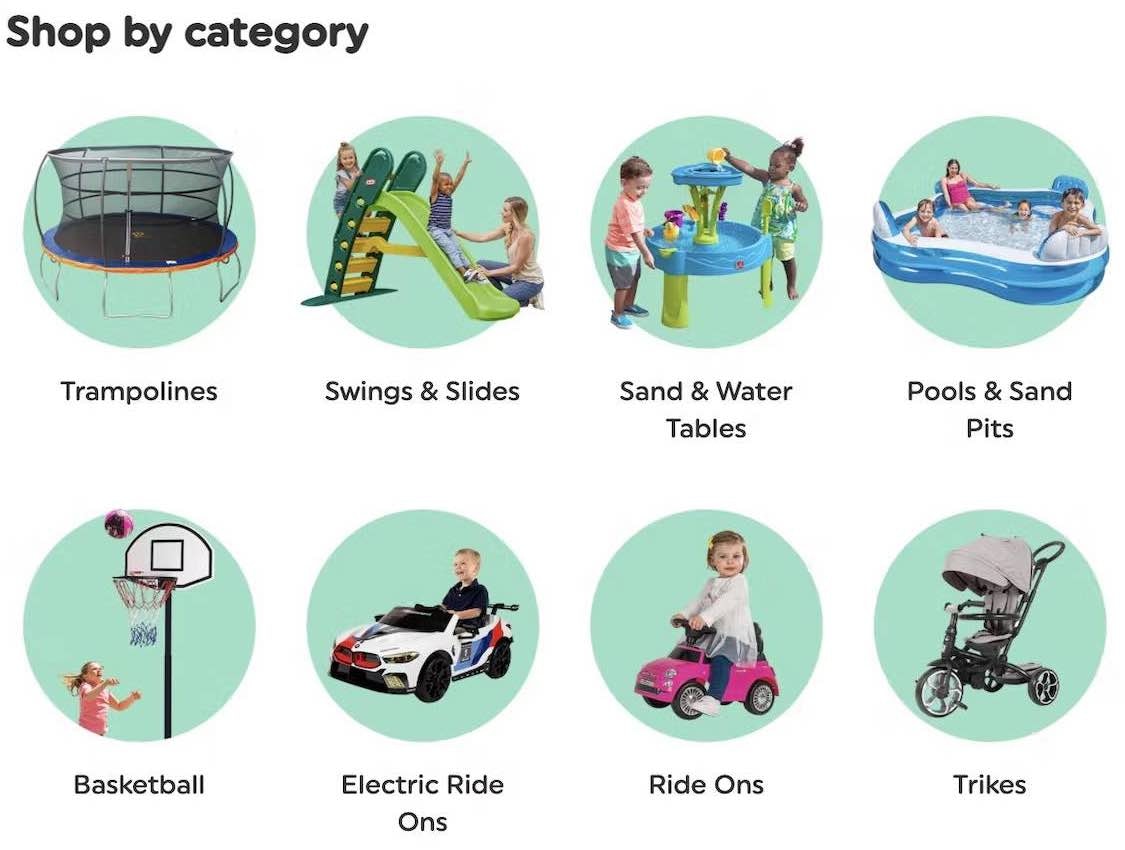
6) 42% of Mobile Sites Don’t Provide a “View All” Option at Each Level of the Product Catalog
Many mobile users want the broadest scope possible within a category; for example “All Men’s Shoes” or “All Backpacks”.
However, because there’s no hover option for mobile users, mobile sites have to determine whether users tapping a main category should expand the subcategories within it, or whether to take users to the landing page for the broad main category item (e.g., a broad product list or an intermediary category page).
In practice, most mobile sites choose the design pattern whereby users keep drilling down the category taxonomy as they tap on a main category option, and only bring users to the category’s landing page or product list when there are no additional subcategory layers left to reveal.
Consequently, during mobile testing some participants had difficulty navigating to the broadest product scopes, making it hard for them to access the most relevant category pages and product lists (see guideline #1006).
Furthermore, some users become stuck in much too narrow and deeply nested subcategories.

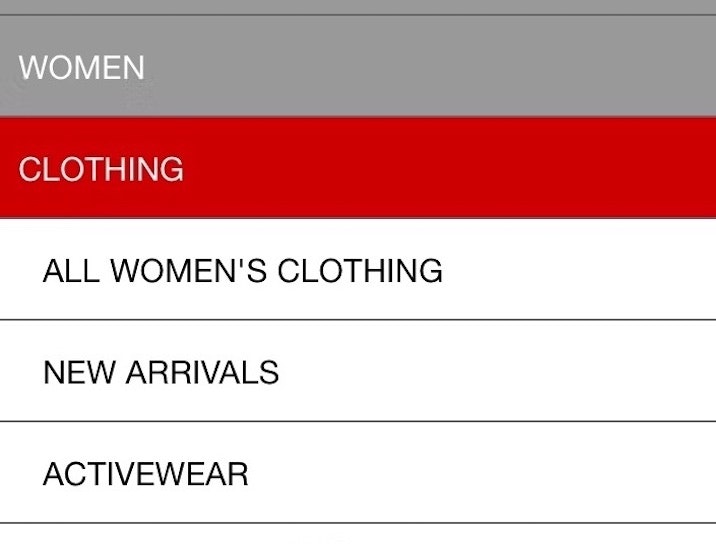
”Wow, that’s a lot of different types of bracelets! I’m just going to click on “All Bracelets”.” A participant at Pandora buying a bracelet for a friend — but unsure what type of bracelet to get her — was pleased that there was a “View All” option in the menu.
What was observed to consistently perform well during testing was to have a “View All” menu item nested within every product category in the hierarchy.
For example, a site with the category “Women” and the subcategories “Clothing” and “Coats” would have a “View All” menu item at each level — thus, “View All Women’s”, “View All Women’s Clothing”, “View All Coats”.
This approach provides users with options when it comes to viewing products — either to keep drilling down until the right subcategory is reached, or to stop and view the current list of products.
7) 94% of Mobile Sites Don’t Highlight the Current Scope in the Main Navigation

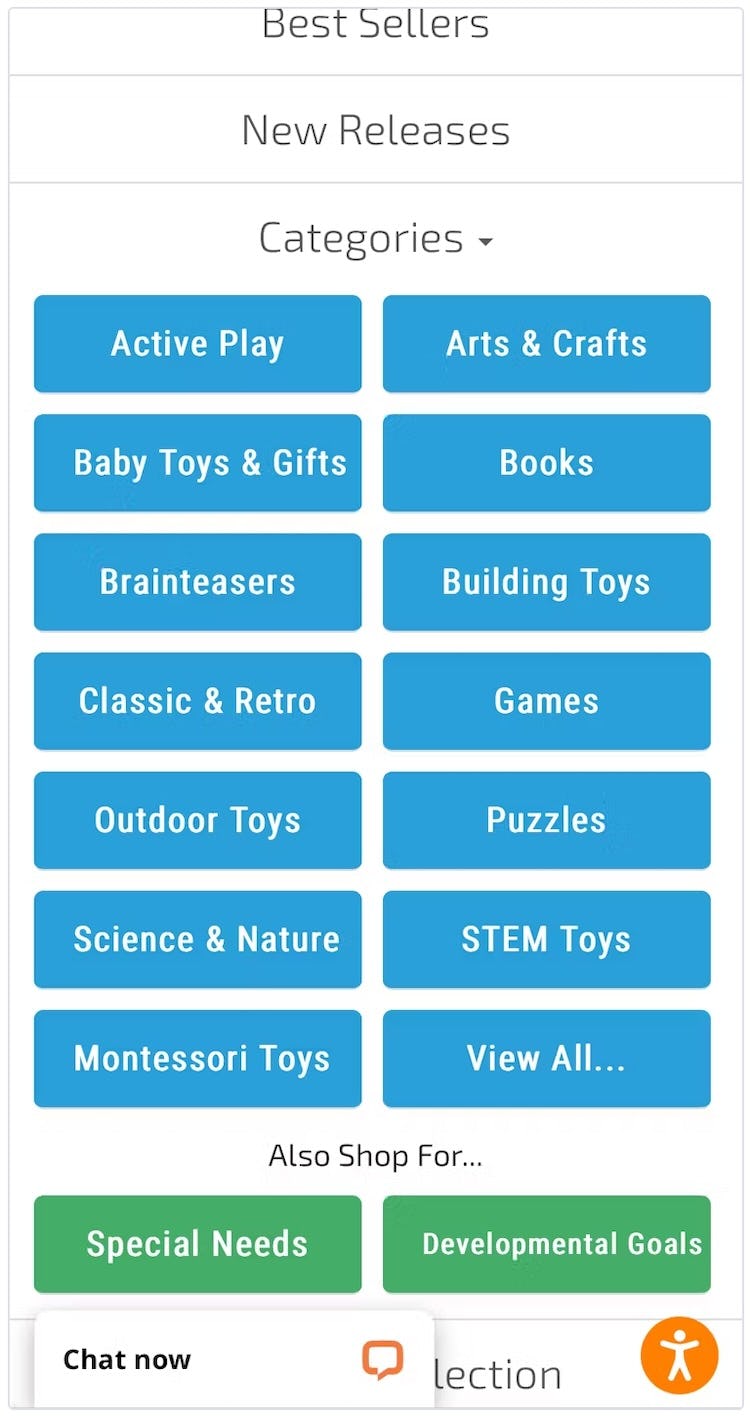
At Fat Brain Toys, a user arriving at a product page for a toy (first image) would not have been able to rely on the main navigation to provide them with a sense of where they were in the site hierarchy (second image).
On mobile, there’s typically no permanently visible main navigation.
However, mobile user behavior was observed in testing to be similar to desktop user behavior, in that several participants during mobile testing tried to open the main navigation to get a sense of where they were within the site hierarchy (especially mobile participants who arrived directly on a product page from off-site).
When the current scope wasn’t highlighted in the main navigation, participants had a more difficult time orienting themselves within the site hierarchy — putting more strain on both breadcrumbs (which were often absent, inconsistently implemented, or truncated) and terminology to perform perfectly to help them learn the site hierarchy (see guideline #300).


Fortunately, providing information on where users are in the main navigation has a somewhat “low-cost” solution: simply highlight their current scope in the main navigation.
On mobile, this also means styling the current scope differently from the other principle navigation options within the main navigation viewport (rather than highlighting this scope in the header, as on desktop).
8) Make All Color Swatches Available in Mobile List Items for Visually Driven Products (73% Don’t )

“It’s annoying when you have to click [into the product page] just to visualize it or just to see it in another color…Like this one for instance, this one here has 11 options. If I’m going to be picky, I’d like to see all 11 of course.” When some swatches aren’t shown in mobile list items, as here on The Company Store (iOS), users have to go to product pages to see the full range — introducing more friction into the process of judging suitability.
In industries such as Apparel and Home Furnishings, items often come in multiple colors.
But if users only see a limited number of swatches in list items, some could assume that the visible swatches represent the only options.
Indeed, during mobile testing, a subset of participants moved very quickly through product lists and search results, and sometimes overlooked small indications of additional color options, such as “+7” or “more colors available” (see guideline #2438).
Moreover, if only a subset of colors are available to users in product lists, they’ll either have to visit product pages to see if any of the “hidden” colors are suitable, or abandon their search if none of the visible colors are suitable.

Color variations are displayed in a scrollable list of swatches on GAP. Note how prominent the scroll arrows on either side of the visible swatches are, making it unlikely that users won’t recognize that the swatches can be scrolled.
On mobile, displaying all swatches in a horizontal scrolling area had a number of advantages for test participants, who easily scrolled swatches using a swipe gesture (as long as hit areas were sufficient) — an intuitive behavior honed through using their mobile device.
Additionally, horizontal scroll areas were observed in mobile testing to be capable of accommodating a potentially very large number of swatches since there are no space limitations — as long as users are fine to keep scrolling, they’ll eventually see all color options available.
However, easy-to-discern scroll arrows should be provided at each side of the horizontal scroll area so that users don’t mistakenly think that there are no more swatches to view.
Alternately, the rightmost swatch should be clearly truncated to indicate that action is needed to see the full swatch — and in turn that there are more available to view.
Finally, the swatches visible by default should be chosen to show a diverse set of colors, or the most popular ones.
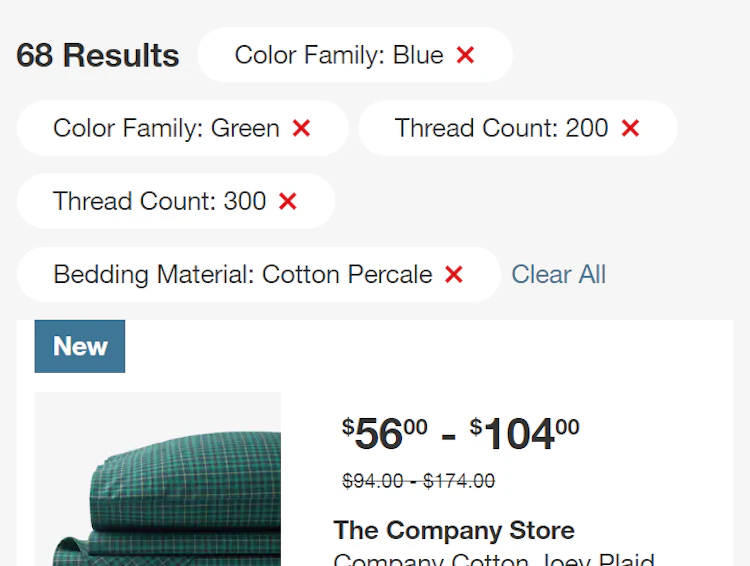
9) Display “Applied Filters” in an Overview (66% Don’t)


On both Williams Sonoma (first image, iOS), and Walmart (second image, iOS), users that have applied filters to the current list have to visit the filtering interface to ascertain which have been applied.


Users that have applied 5 filters on Hamleys’ (first image) and have spent time scrolling through the resulting product list (second image) — with a few detours to product pages — could easily lose track of its scope. When this happens, users can make incorrect assumptions about the scope and incorrectly conclude that there are no suitable items available. (The overview within the filtering interface is somewhat helpful while users are in there, but of no help when they are scrolling the list.)
When users apply filters to product lists or search results, almost all sites confirm the choice where the filter was originally chosen (e.g., by adding a tick mark to a filter option checkbox; see #479).
However, during testing, if the original filter location was the only place where an applied filter was indicated, the process of tailoring the list was slowed and some participants didn’t properly understand the scope of the list. (See also #488 for advice on applied filter overviews on desktop).

American Eagle stacks applied filters above product lists and search results, making it clear to users how the list is scoped.

Applied filters on Living Spaces are displayed in horizontally scrolling lists, allowing users to check which ones they have already applied without having to visit the filtering interface.
To help users in the process of applying and removing filters, display an “Applied Filters Overview” above the mobile product list and search results.
Doing so will allow users to confirm what filters they have already applied as well as giving them an overview of what’s defining the scope of the list.
This is especially useful when users have applied multiple filters and are reassessing their helpfulness.
For example, if the list contains too few items, users might want to remove some filters; conversely, if the list is too large, they might consider adding more.
Being able to see what they have already applied gives users the information they need to decide on what to do next.
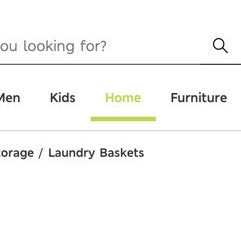
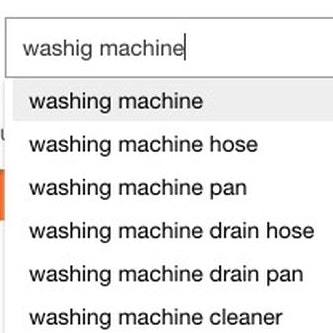
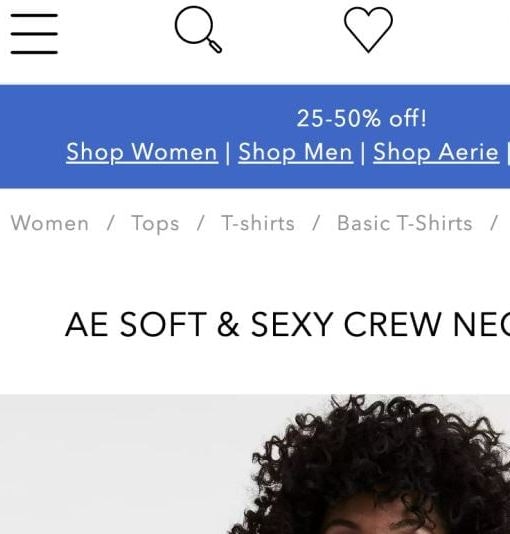
10) Offer Relevant Autocomplete Suggestions for Closely Misspelled Search Terms and Queries (28% Don’t)

“So I’m going to try here. No. So this search doesn’t work because it looks like it’s specific to t-shirts.” Because no autocomplete suggestions appeared in response to a mistyped search term, this test participant on the eBay app (iOS) assumed that no relevant results were forthcoming. Not correcting simple misspellings can disrupt users significantly.
During testing, nearly all participants relied on the guidance of autocomplete suggestions at least once when composing search queries.
However, if the slightest spelling error (e.g., searching “furnture” instead of “furniture”) was included in a submitted search term, many of the search attempts failed.
Indeed, participants’ misspelled queries were frequently met with autocomplete suggestions that were irrelevant or that disappeared once an error was detected, effectively removing the very guidance that the suggestions are intended to provide (see guideline #1001).


“Oh, I didn’t spell it right. iPhone, iPhone 15 case. So I’ll click that and scroll through.” This test participant on the Best Buy app (iOS) was able to recover from a typo (“iphoke 15”) by tapping one of the relevant autocomplete suggestions that appeared despite the error.
Instead, autocomplete’s relevance can be enhanced by mapping misspelled words to meaningful autocomplete suggestions.
Using either spell check solutions or manual mapping of terms (or, most likely, both methods) will help ensure users can smoothly proceed with investigating products, rather than reaching a dead end.
Many Opportunities Exist to Improve Mobile UX
This high-level analysis of the current state of Mobile UX focuses on only 10 of the 450+ mobile guidelines included in our ecommerce UX Mobile Research study.
To gain a comprehensive understanding of the current state of Mobile UX, the other mobile guidelines should be reviewed to identify mobile issues not covered here.
For inspiration regarding other sites’ implementations and to see how they perform UX-wise, head to the publicly available part of the Mobile ecommerce UX benchmark.
For additional inspiration, consider clicking through the Mobile Page Designs (click the “Mobile” filter for the specific page design you’re viewing), as these showcase mobile implementations at hundreds of leading US and European ecommerce sites.
These page designs can be a good resource when considering redesigning a mobile site for what to emulate — but also for what to avoid.
This article presents the research findings from just a few of the 700+ UX guidelines in Baymard – get full access to learn how to create a “State of the Art” ecommerce user experience.
If you want to know how your desktop site, mobile site, or app performs and compares, then consider a Baymard UX Audit of your site or app.